Paraguayan vs Yuman In Labor Force | Age 20-64
COMPARE
Paraguayan
Yuman
In Labor Force | Age 20-64
In Labor Force | Age 20-64 Comparison
Paraguayans
Yuman
80.6%
IN LABOR FORCE | AGE 20-64
99.8/ 100
METRIC RATING
36th/ 347
METRIC RANK
71.7%
IN LABOR FORCE | AGE 20-64
0.0/ 100
METRIC RATING
342nd/ 347
METRIC RANK
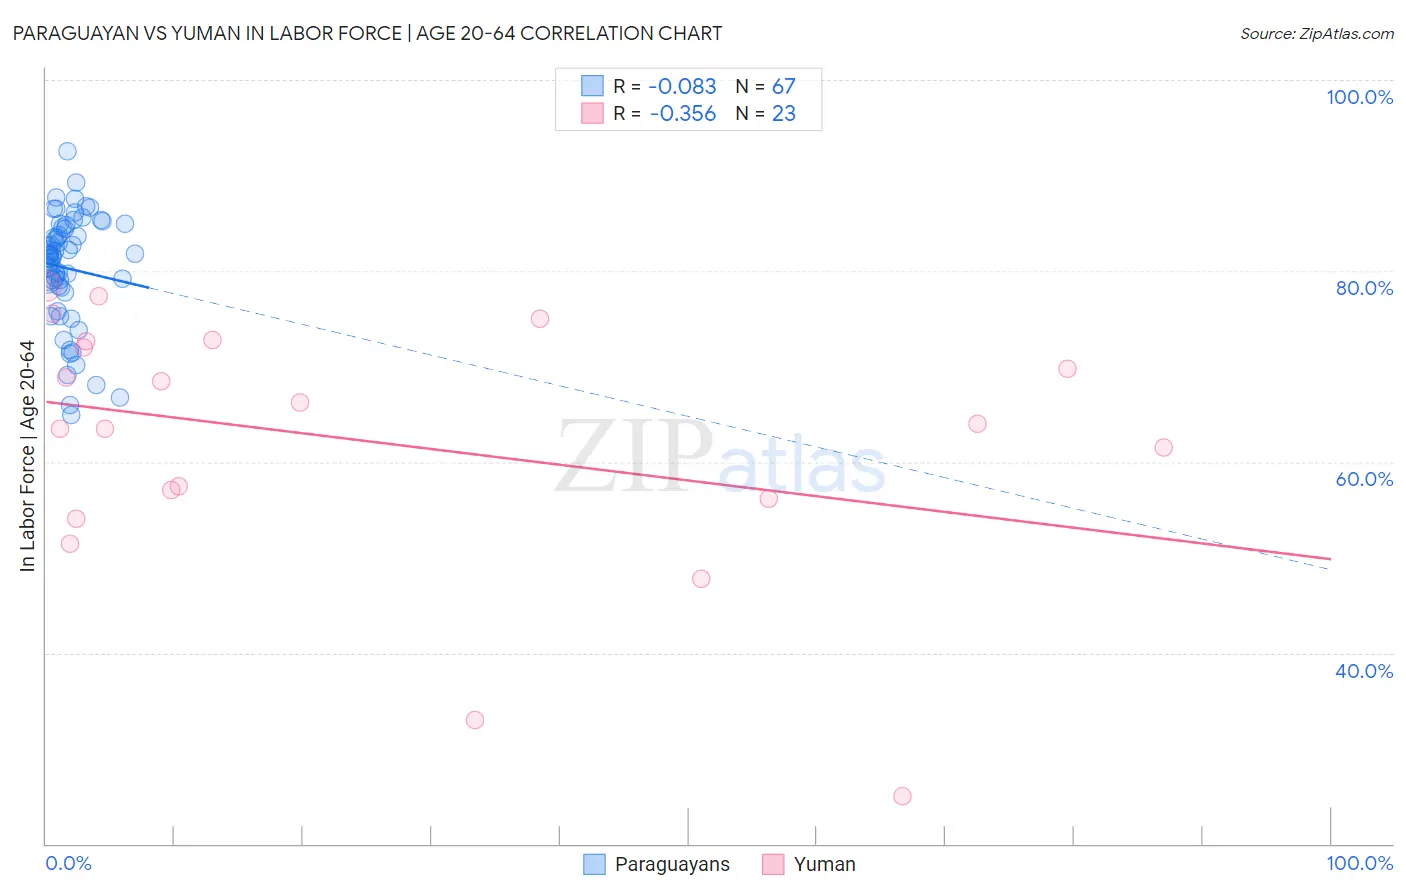
Paraguayan vs Yuman In Labor Force | Age 20-64 Correlation Chart
The statistical analysis conducted on geographies consisting of 95,114,808 people shows a slight negative correlation between the proportion of Paraguayans and labor force participation rate among population between the ages 20 and 64 in the United States with a correlation coefficient (R) of -0.083 and weighted average of 80.6%. Similarly, the statistical analysis conducted on geographies consisting of 40,686,052 people shows a mild negative correlation between the proportion of Yuman and labor force participation rate among population between the ages 20 and 64 in the United States with a correlation coefficient (R) of -0.356 and weighted average of 71.7%, a difference of 12.3%.
In Labor Force | Age 20-64 Correlation Summary
| Measurement | Paraguayan | Yuman |
| Minimum | 64.9% | 25.0% |
| Maximum | 92.6% | 78.4% |
| Range | 27.7% | 53.4% |
| Mean | 80.3% | 62.2% |
| Median | 81.7% | 64.0% |
| Interquartile 25% (IQ1) | 78.3% | 56.1% |
| Interquartile 75% (IQ3) | 84.6% | 72.6% |
| Interquartile Range (IQR) | 6.3% | 16.5% |
| Standard Deviation (Sample) | 5.9% | 13.5% |
| Standard Deviation (Population) | 5.9% | 13.2% |
Similar Demographics by In Labor Force | Age 20-64
Demographics Similar to Paraguayans by In Labor Force | Age 20-64
In terms of in labor force | age 20-64, the demographic groups most similar to Paraguayans are Immigrants from Moldova (80.6%, a difference of 0.0%), Ugandan (80.6%, a difference of 0.020%), Brazilian (80.5%, a difference of 0.030%), Immigrants from Zimbabwe (80.5%, a difference of 0.030%), and Immigrants from Liberia (80.5%, a difference of 0.050%).
| Demographics | Rating | Rank | In Labor Force | Age 20-64 |
| Immigrants | South Central Asia | 99.9 /100 | #29 | Exceptional 80.7% |
| Immigrants | North Macedonia | 99.9 /100 | #30 | Exceptional 80.7% |
| Immigrants | Lithuania | 99.9 /100 | #31 | Exceptional 80.7% |
| Immigrants | Ireland | 99.9 /100 | #32 | Exceptional 80.7% |
| Chinese | 99.9 /100 | #33 | Exceptional 80.7% |
| Immigrants | Brazil | 99.9 /100 | #34 | Exceptional 80.7% |
| Immigrants | Poland | 99.9 /100 | #35 | Exceptional 80.6% |
| Paraguayans | 99.8 /100 | #36 | Exceptional 80.6% |
| Immigrants | Moldova | 99.8 /100 | #37 | Exceptional 80.6% |
| Ugandans | 99.8 /100 | #38 | Exceptional 80.6% |
| Brazilians | 99.8 /100 | #39 | Exceptional 80.5% |
| Immigrants | Zimbabwe | 99.8 /100 | #40 | Exceptional 80.5% |
| Immigrants | Liberia | 99.8 /100 | #41 | Exceptional 80.5% |
| Latvians | 99.8 /100 | #42 | Exceptional 80.5% |
| Czechs | 99.7 /100 | #43 | Exceptional 80.5% |
Demographics Similar to Yuman by In Labor Force | Age 20-64
In terms of in labor force | age 20-64, the demographic groups most similar to Yuman are Hopi (71.7%, a difference of 0.020%), Immigrants from Yemen (72.3%, a difference of 0.78%), Pueblo (72.6%, a difference of 1.3%), Houma (72.7%, a difference of 1.4%), and Lumbee (70.6%, a difference of 1.5%).
| Demographics | Rating | Rank | In Labor Force | Age 20-64 |
| Natives/Alaskans | 0.0 /100 | #333 | Tragic 73.9% |
| Apache | 0.0 /100 | #334 | Tragic 73.7% |
| Ute | 0.0 /100 | #335 | Tragic 73.7% |
| Crow | 0.0 /100 | #336 | Tragic 73.3% |
| Yup'ik | 0.0 /100 | #337 | Tragic 73.2% |
| Puerto Ricans | 0.0 /100 | #338 | Tragic 73.1% |
| Houma | 0.0 /100 | #339 | Tragic 72.7% |
| Pueblo | 0.0 /100 | #340 | Tragic 72.6% |
| Immigrants | Yemen | 0.0 /100 | #341 | Tragic 72.3% |
| Yuman | 0.0 /100 | #342 | Tragic 71.7% |
| Hopi | 0.0 /100 | #343 | Tragic 71.7% |
| Lumbee | 0.0 /100 | #344 | Tragic 70.6% |
| Tohono O'odham | 0.0 /100 | #345 | Tragic 70.4% |
| Navajo | 0.0 /100 | #346 | Tragic 69.2% |
| Pima | 0.0 /100 | #347 | Tragic 69.0% |