Paraguayan vs Jamaican In Labor Force | Age 20-64
COMPARE
Paraguayan
Jamaican
In Labor Force | Age 20-64
In Labor Force | Age 20-64 Comparison
Paraguayans
Jamaicans
80.6%
IN LABOR FORCE | AGE 20-64
99.8/ 100
METRIC RATING
36th/ 347
METRIC RANK
78.9%
IN LABOR FORCE | AGE 20-64
2.0/ 100
METRIC RATING
241st/ 347
METRIC RANK
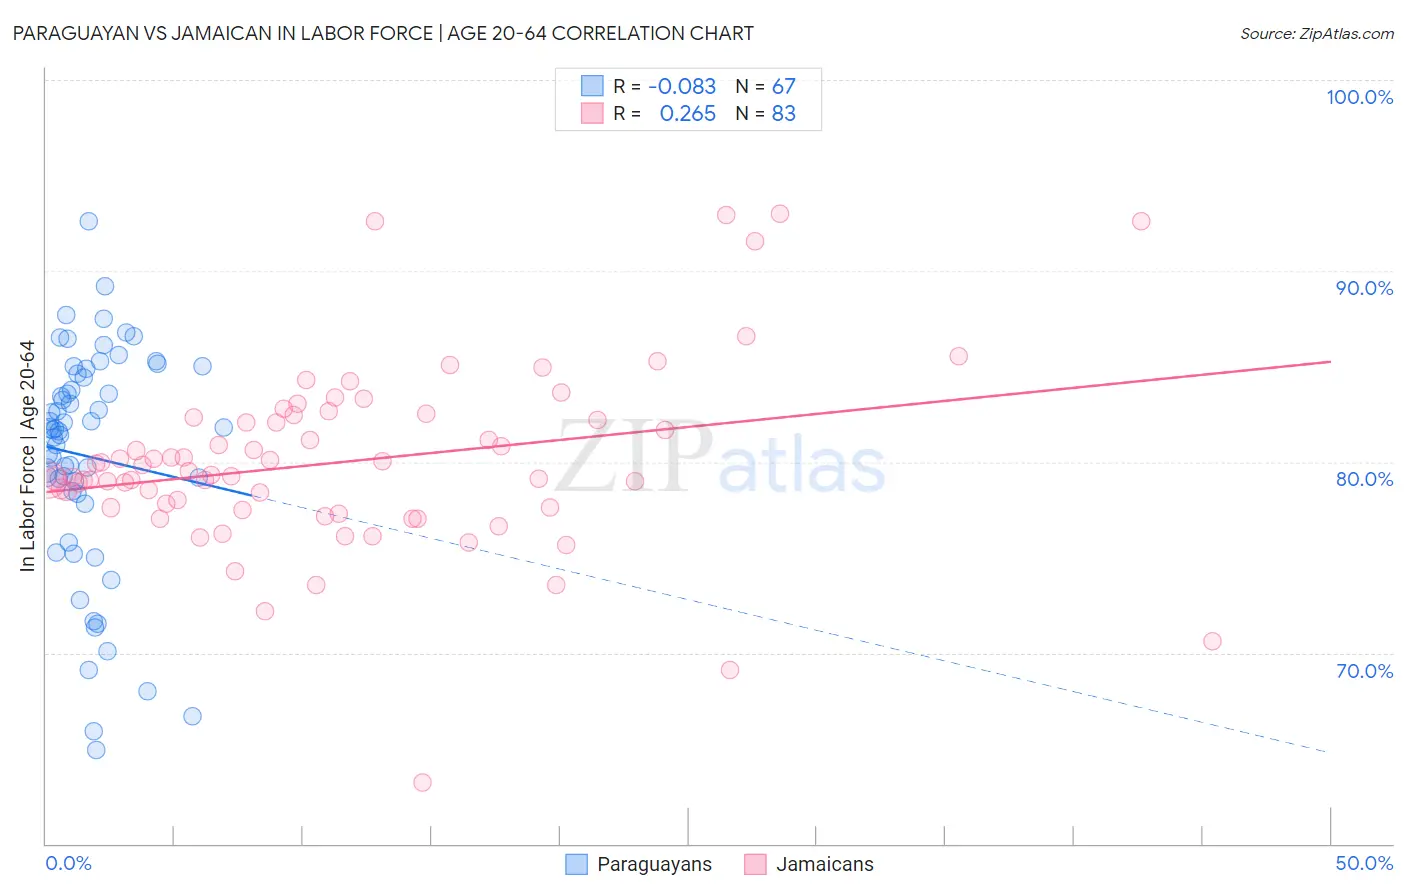
Paraguayan vs Jamaican In Labor Force | Age 20-64 Correlation Chart
The statistical analysis conducted on geographies consisting of 95,114,808 people shows a slight negative correlation between the proportion of Paraguayans and labor force participation rate among population between the ages 20 and 64 in the United States with a correlation coefficient (R) of -0.083 and weighted average of 80.6%. Similarly, the statistical analysis conducted on geographies consisting of 368,081,015 people shows a weak positive correlation between the proportion of Jamaicans and labor force participation rate among population between the ages 20 and 64 in the United States with a correlation coefficient (R) of 0.265 and weighted average of 78.9%, a difference of 2.1%.
In Labor Force | Age 20-64 Correlation Summary
| Measurement | Paraguayan | Jamaican |
| Minimum | 64.9% | 63.2% |
| Maximum | 92.6% | 93.0% |
| Range | 27.7% | 29.8% |
| Mean | 80.3% | 80.0% |
| Median | 81.7% | 79.3% |
| Interquartile 25% (IQ1) | 78.3% | 77.6% |
| Interquartile 75% (IQ3) | 84.6% | 82.3% |
| Interquartile Range (IQR) | 6.3% | 4.7% |
| Standard Deviation (Sample) | 5.9% | 4.9% |
| Standard Deviation (Population) | 5.9% | 4.8% |
Similar Demographics by In Labor Force | Age 20-64
Demographics Similar to Paraguayans by In Labor Force | Age 20-64
In terms of in labor force | age 20-64, the demographic groups most similar to Paraguayans are Immigrants from Moldova (80.6%, a difference of 0.0%), Ugandan (80.6%, a difference of 0.020%), Brazilian (80.5%, a difference of 0.030%), Immigrants from Zimbabwe (80.5%, a difference of 0.030%), and Immigrants from Liberia (80.5%, a difference of 0.050%).
| Demographics | Rating | Rank | In Labor Force | Age 20-64 |
| Immigrants | South Central Asia | 99.9 /100 | #29 | Exceptional 80.7% |
| Immigrants | North Macedonia | 99.9 /100 | #30 | Exceptional 80.7% |
| Immigrants | Lithuania | 99.9 /100 | #31 | Exceptional 80.7% |
| Immigrants | Ireland | 99.9 /100 | #32 | Exceptional 80.7% |
| Chinese | 99.9 /100 | #33 | Exceptional 80.7% |
| Immigrants | Brazil | 99.9 /100 | #34 | Exceptional 80.7% |
| Immigrants | Poland | 99.9 /100 | #35 | Exceptional 80.6% |
| Paraguayans | 99.8 /100 | #36 | Exceptional 80.6% |
| Immigrants | Moldova | 99.8 /100 | #37 | Exceptional 80.6% |
| Ugandans | 99.8 /100 | #38 | Exceptional 80.6% |
| Brazilians | 99.8 /100 | #39 | Exceptional 80.5% |
| Immigrants | Zimbabwe | 99.8 /100 | #40 | Exceptional 80.5% |
| Immigrants | Liberia | 99.8 /100 | #41 | Exceptional 80.5% |
| Latvians | 99.8 /100 | #42 | Exceptional 80.5% |
| Czechs | 99.7 /100 | #43 | Exceptional 80.5% |
Demographics Similar to Jamaicans by In Labor Force | Age 20-64
In terms of in labor force | age 20-64, the demographic groups most similar to Jamaicans are Immigrants from Micronesia (78.9%, a difference of 0.010%), Trinidadian and Tobagonian (79.0%, a difference of 0.030%), Immigrants from West Indies (78.9%, a difference of 0.030%), Welsh (79.0%, a difference of 0.040%), and Immigrants from Jamaica (79.0%, a difference of 0.050%).
| Demographics | Rating | Rank | In Labor Force | Age 20-64 |
| Immigrants | Canada | 3.2 /100 | #234 | Tragic 79.0% |
| Tlingit-Haida | 3.2 /100 | #235 | Tragic 79.0% |
| Samoans | 2.9 /100 | #236 | Tragic 79.0% |
| Immigrants | North America | 2.9 /100 | #237 | Tragic 79.0% |
| Immigrants | Jamaica | 2.6 /100 | #238 | Tragic 79.0% |
| Welsh | 2.4 /100 | #239 | Tragic 79.0% |
| Trinidadians and Tobagonians | 2.3 /100 | #240 | Tragic 79.0% |
| Jamaicans | 2.0 /100 | #241 | Tragic 78.9% |
| Immigrants | Micronesia | 1.9 /100 | #242 | Tragic 78.9% |
| Immigrants | West Indies | 1.7 /100 | #243 | Tragic 78.9% |
| French | 1.5 /100 | #244 | Tragic 78.9% |
| Scottish | 1.3 /100 | #245 | Tragic 78.9% |
| Immigrants | Trinidad and Tobago | 1.1 /100 | #246 | Tragic 78.8% |
| Immigrants | Germany | 1.0 /100 | #247 | Tragic 78.8% |
| Immigrants | Caribbean | 1.0 /100 | #248 | Tragic 78.8% |