Paraguayan vs Spaniard In Labor Force | Age 20-64
COMPARE
Paraguayan
Spaniard
In Labor Force | Age 20-64
In Labor Force | Age 20-64 Comparison
Paraguayans
Spaniards
80.6%
IN LABOR FORCE | AGE 20-64
99.8/ 100
METRIC RATING
36th/ 347
METRIC RANK
78.4%
IN LABOR FORCE | AGE 20-64
0.1/ 100
METRIC RATING
264th/ 347
METRIC RANK
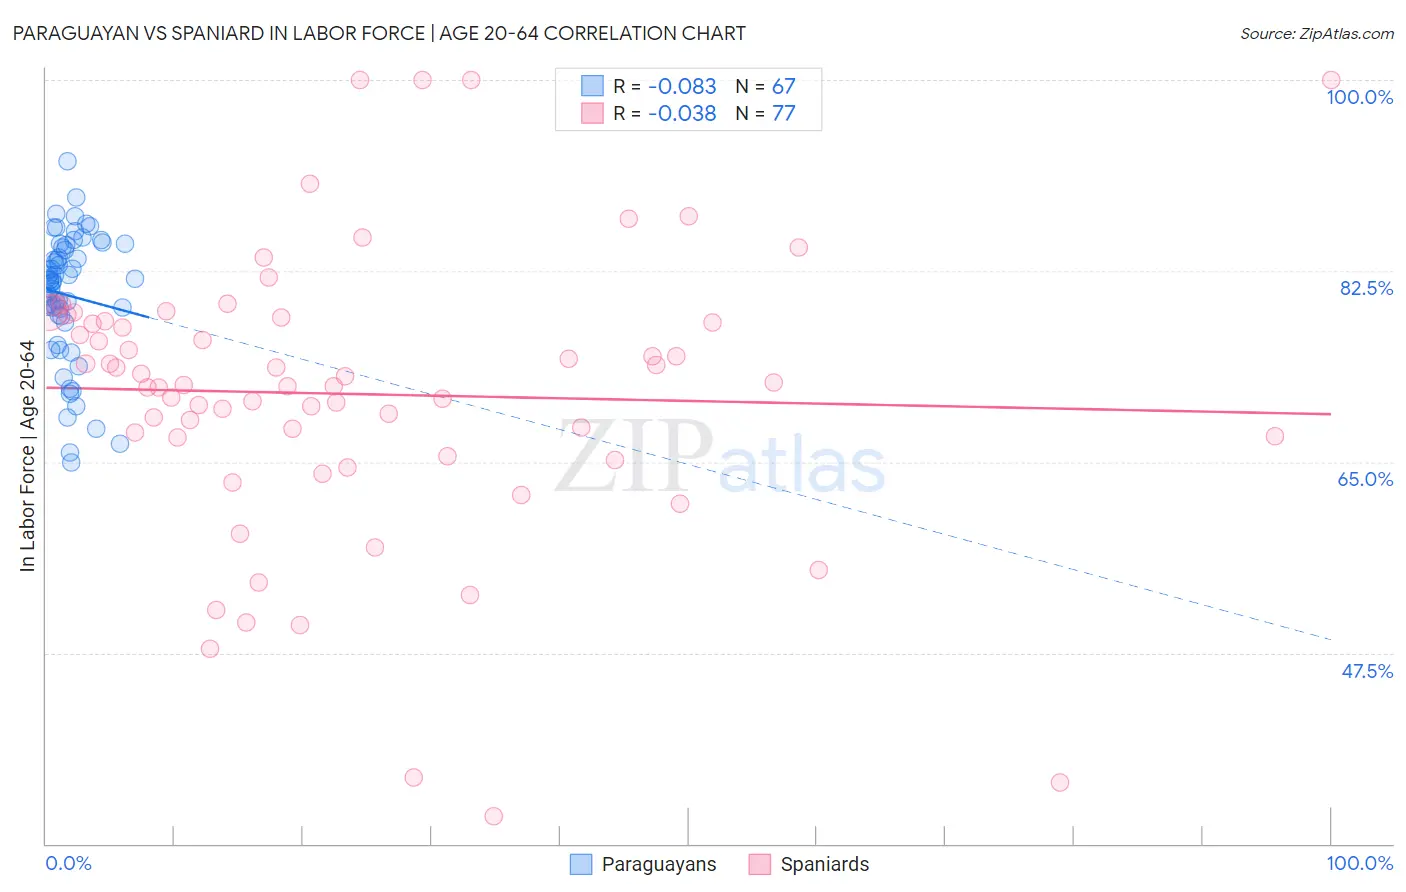
Paraguayan vs Spaniard In Labor Force | Age 20-64 Correlation Chart
The statistical analysis conducted on geographies consisting of 95,114,808 people shows a slight negative correlation between the proportion of Paraguayans and labor force participation rate among population between the ages 20 and 64 in the United States with a correlation coefficient (R) of -0.083 and weighted average of 80.6%. Similarly, the statistical analysis conducted on geographies consisting of 443,546,282 people shows no correlation between the proportion of Spaniards and labor force participation rate among population between the ages 20 and 64 in the United States with a correlation coefficient (R) of -0.038 and weighted average of 78.4%, a difference of 2.8%.
In Labor Force | Age 20-64 Correlation Summary
| Measurement | Paraguayan | Spaniard |
| Minimum | 64.9% | 32.5% |
| Maximum | 92.6% | 100.0% |
| Range | 27.7% | 67.5% |
| Mean | 80.3% | 71.2% |
| Median | 81.7% | 72.1% |
| Interquartile 25% (IQ1) | 78.3% | 66.4% |
| Interquartile 75% (IQ3) | 84.6% | 78.0% |
| Interquartile Range (IQR) | 6.3% | 11.7% |
| Standard Deviation (Sample) | 5.9% | 13.2% |
| Standard Deviation (Population) | 5.9% | 13.1% |
Similar Demographics by In Labor Force | Age 20-64
Demographics Similar to Paraguayans by In Labor Force | Age 20-64
In terms of in labor force | age 20-64, the demographic groups most similar to Paraguayans are Immigrants from Moldova (80.6%, a difference of 0.0%), Ugandan (80.6%, a difference of 0.020%), Brazilian (80.5%, a difference of 0.030%), Immigrants from Zimbabwe (80.5%, a difference of 0.030%), and Immigrants from Liberia (80.5%, a difference of 0.050%).
| Demographics | Rating | Rank | In Labor Force | Age 20-64 |
| Immigrants | South Central Asia | 99.9 /100 | #29 | Exceptional 80.7% |
| Immigrants | North Macedonia | 99.9 /100 | #30 | Exceptional 80.7% |
| Immigrants | Lithuania | 99.9 /100 | #31 | Exceptional 80.7% |
| Immigrants | Ireland | 99.9 /100 | #32 | Exceptional 80.7% |
| Chinese | 99.9 /100 | #33 | Exceptional 80.7% |
| Immigrants | Brazil | 99.9 /100 | #34 | Exceptional 80.7% |
| Immigrants | Poland | 99.9 /100 | #35 | Exceptional 80.6% |
| Paraguayans | 99.8 /100 | #36 | Exceptional 80.6% |
| Immigrants | Moldova | 99.8 /100 | #37 | Exceptional 80.6% |
| Ugandans | 99.8 /100 | #38 | Exceptional 80.6% |
| Brazilians | 99.8 /100 | #39 | Exceptional 80.5% |
| Immigrants | Zimbabwe | 99.8 /100 | #40 | Exceptional 80.5% |
| Immigrants | Liberia | 99.8 /100 | #41 | Exceptional 80.5% |
| Latvians | 99.8 /100 | #42 | Exceptional 80.5% |
| Czechs | 99.7 /100 | #43 | Exceptional 80.5% |
Demographics Similar to Spaniards by In Labor Force | Age 20-64
In terms of in labor force | age 20-64, the demographic groups most similar to Spaniards are Pennsylvania German (78.4%, a difference of 0.010%), Fijian (78.4%, a difference of 0.020%), British West Indian (78.4%, a difference of 0.040%), Bahamian (78.4%, a difference of 0.050%), and U.S. Virgin Islander (78.4%, a difference of 0.070%).
| Demographics | Rating | Rank | In Labor Force | Age 20-64 |
| Guatemalans | 0.4 /100 | #257 | Tragic 78.7% |
| Immigrants | Guatemala | 0.4 /100 | #258 | Tragic 78.7% |
| Tsimshian | 0.4 /100 | #259 | Tragic 78.7% |
| Immigrants | Fiji | 0.3 /100 | #260 | Tragic 78.6% |
| Whites/Caucasians | 0.2 /100 | #261 | Tragic 78.5% |
| Fijians | 0.1 /100 | #262 | Tragic 78.4% |
| Pennsylvania Germans | 0.1 /100 | #263 | Tragic 78.4% |
| Spaniards | 0.1 /100 | #264 | Tragic 78.4% |
| British West Indians | 0.1 /100 | #265 | Tragic 78.4% |
| Bahamians | 0.1 /100 | #266 | Tragic 78.4% |
| U.S. Virgin Islanders | 0.1 /100 | #267 | Tragic 78.4% |
| West Indians | 0.0 /100 | #268 | Tragic 78.3% |
| Immigrants | Barbados | 0.0 /100 | #269 | Tragic 78.3% |
| Scotch-Irish | 0.0 /100 | #270 | Tragic 78.3% |
| Immigrants | Latin America | 0.0 /100 | #271 | Tragic 78.3% |