Pakistani vs Immigrants from Nicaragua In Labor Force | Age 16-19
COMPARE
Pakistani
Immigrants from Nicaragua
In Labor Force | Age 16-19
In Labor Force | Age 16-19 Comparison
Pakistanis
Immigrants from Nicaragua
37.6%
IN LABOR FORCE | AGE 16-19
89.5/ 100
METRIC RATING
143rd/ 347
METRIC RANK
31.6%
IN LABOR FORCE | AGE 16-19
0.0/ 100
METRIC RATING
317th/ 347
METRIC RANK
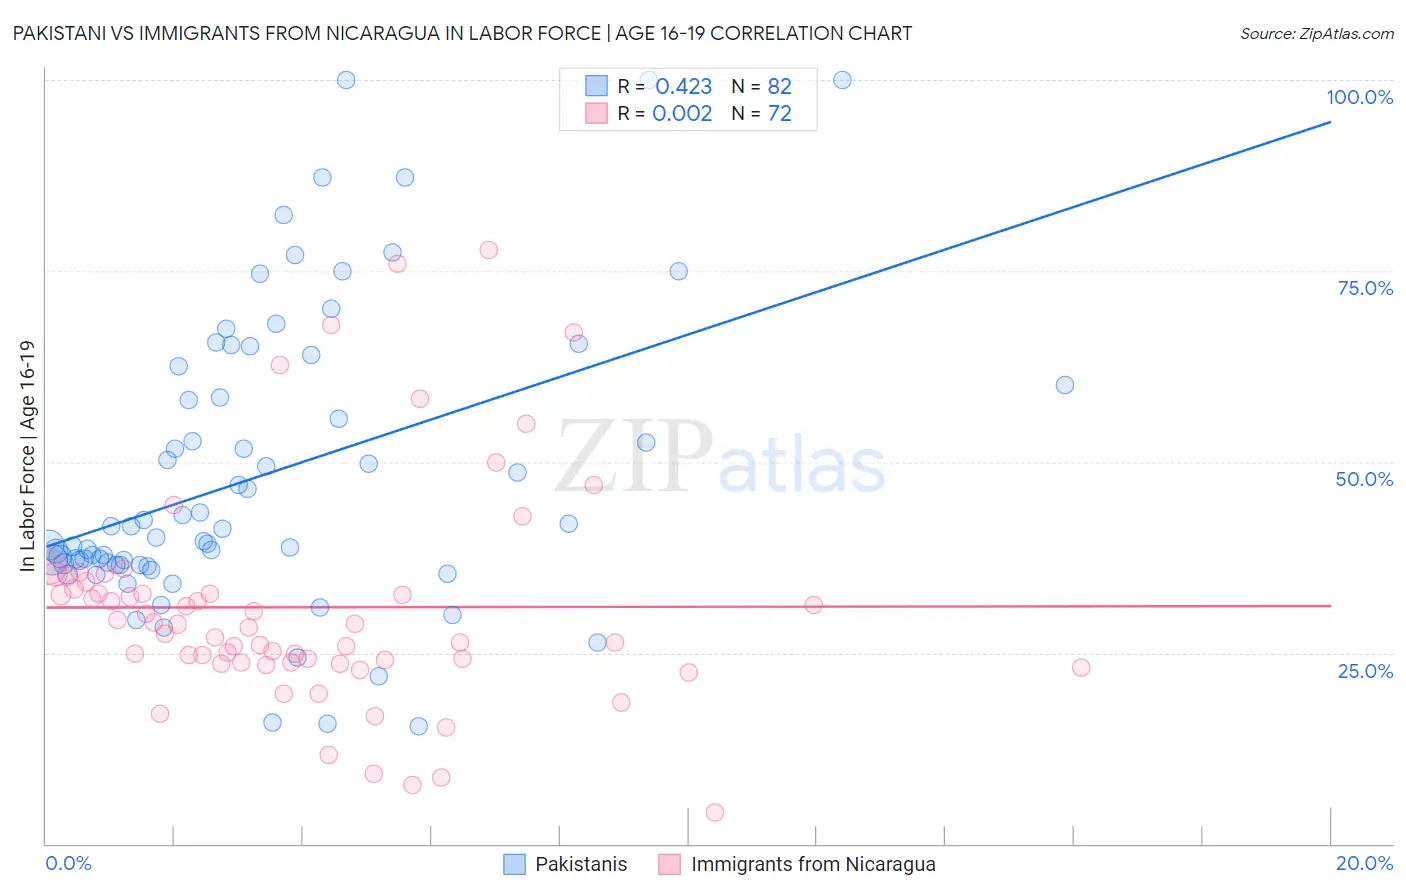
Pakistani vs Immigrants from Nicaragua In Labor Force | Age 16-19 Correlation Chart
The statistical analysis conducted on geographies consisting of 335,000,628 people shows a moderate positive correlation between the proportion of Pakistanis and labor force participation rate among population between the ages 16 and 19 in the United States with a correlation coefficient (R) of 0.423 and weighted average of 37.6%. Similarly, the statistical analysis conducted on geographies consisting of 236,189,359 people shows no correlation between the proportion of Immigrants from Nicaragua and labor force participation rate among population between the ages 16 and 19 in the United States with a correlation coefficient (R) of 0.002 and weighted average of 31.6%, a difference of 18.8%.
In Labor Force | Age 16-19 Correlation Summary
| Measurement | Pakistani | Immigrants from Nicaragua |
| Minimum | 15.4% | 4.1% |
| Maximum | 100.0% | 77.8% |
| Range | 84.6% | 73.7% |
| Mean | 48.1% | 31.0% |
| Median | 40.7% | 28.5% |
| Interquartile 25% (IQ1) | 36.5% | 23.7% |
| Interquartile 75% (IQ3) | 60.0% | 33.8% |
| Interquartile Range (IQR) | 23.5% | 10.1% |
| Standard Deviation (Sample) | 19.2% | 14.5% |
| Standard Deviation (Population) | 19.1% | 14.4% |
Similar Demographics by In Labor Force | Age 16-19
Demographics Similar to Pakistanis by In Labor Force | Age 16-19
In terms of in labor force | age 16-19, the demographic groups most similar to Pakistanis are Japanese (37.5%, a difference of 0.020%), Paiute (37.5%, a difference of 0.020%), Sierra Leonean (37.6%, a difference of 0.030%), Immigrants from Western Europe (37.5%, a difference of 0.070%), and Brazilian (37.5%, a difference of 0.10%).
| Demographics | Rating | Rank | In Labor Force | Age 16-19 |
| Australians | 93.2 /100 | #136 | Exceptional 37.8% |
| Cajuns | 93.2 /100 | #137 | Exceptional 37.8% |
| Comanche | 91.9 /100 | #138 | Exceptional 37.7% |
| Immigrants | Moldova | 91.9 /100 | #139 | Exceptional 37.7% |
| Estonians | 91.7 /100 | #140 | Exceptional 37.7% |
| Syrians | 90.7 /100 | #141 | Exceptional 37.6% |
| Sierra Leoneans | 89.7 /100 | #142 | Excellent 37.6% |
| Pakistanis | 89.5 /100 | #143 | Excellent 37.6% |
| Japanese | 89.3 /100 | #144 | Excellent 37.5% |
| Paiute | 89.3 /100 | #145 | Excellent 37.5% |
| Immigrants | Western Europe | 88.9 /100 | #146 | Excellent 37.5% |
| Brazilians | 88.7 /100 | #147 | Excellent 37.5% |
| Romanians | 87.3 /100 | #148 | Excellent 37.5% |
| Native Hawaiians | 85.0 /100 | #149 | Excellent 37.4% |
| Tsimshian | 84.7 /100 | #150 | Excellent 37.4% |
Demographics Similar to Immigrants from Nicaragua by In Labor Force | Age 16-19
In terms of in labor force | age 16-19, the demographic groups most similar to Immigrants from Nicaragua are Filipino (31.7%, a difference of 0.19%), Immigrants from West Indies (31.7%, a difference of 0.28%), Immigrants from Yemen (31.5%, a difference of 0.34%), Cuban (31.8%, a difference of 0.46%), and Hopi (31.8%, a difference of 0.61%).
| Demographics | Rating | Rank | In Labor Force | Age 16-19 |
| Immigrants | Iran | 0.0 /100 | #310 | Tragic 32.0% |
| Indians (Asian) | 0.0 /100 | #311 | Tragic 31.9% |
| Immigrants | Belize | 0.0 /100 | #312 | Tragic 31.8% |
| Hopi | 0.0 /100 | #313 | Tragic 31.8% |
| Cubans | 0.0 /100 | #314 | Tragic 31.8% |
| Immigrants | West Indies | 0.0 /100 | #315 | Tragic 31.7% |
| Filipinos | 0.0 /100 | #316 | Tragic 31.7% |
| Immigrants | Nicaragua | 0.0 /100 | #317 | Tragic 31.6% |
| Immigrants | Yemen | 0.0 /100 | #318 | Tragic 31.5% |
| Soviet Union | 0.0 /100 | #319 | Tragic 31.4% |
| Ecuadorians | 0.0 /100 | #320 | Tragic 31.4% |
| West Indians | 0.0 /100 | #321 | Tragic 31.3% |
| Tohono O'odham | 0.0 /100 | #322 | Tragic 31.3% |
| Immigrants | Caribbean | 0.0 /100 | #323 | Tragic 31.2% |
| Dominicans | 0.0 /100 | #324 | Tragic 31.2% |