Pakistani vs Immigrants from Lithuania In Labor Force | Age 16-19
COMPARE
Pakistani
Immigrants from Lithuania
In Labor Force | Age 16-19
In Labor Force | Age 16-19 Comparison
Pakistanis
Immigrants from Lithuania
37.6%
IN LABOR FORCE | AGE 16-19
89.5/ 100
METRIC RATING
143rd/ 347
METRIC RANK
37.2%
IN LABOR FORCE | AGE 16-19
80.7/ 100
METRIC RATING
155th/ 347
METRIC RANK
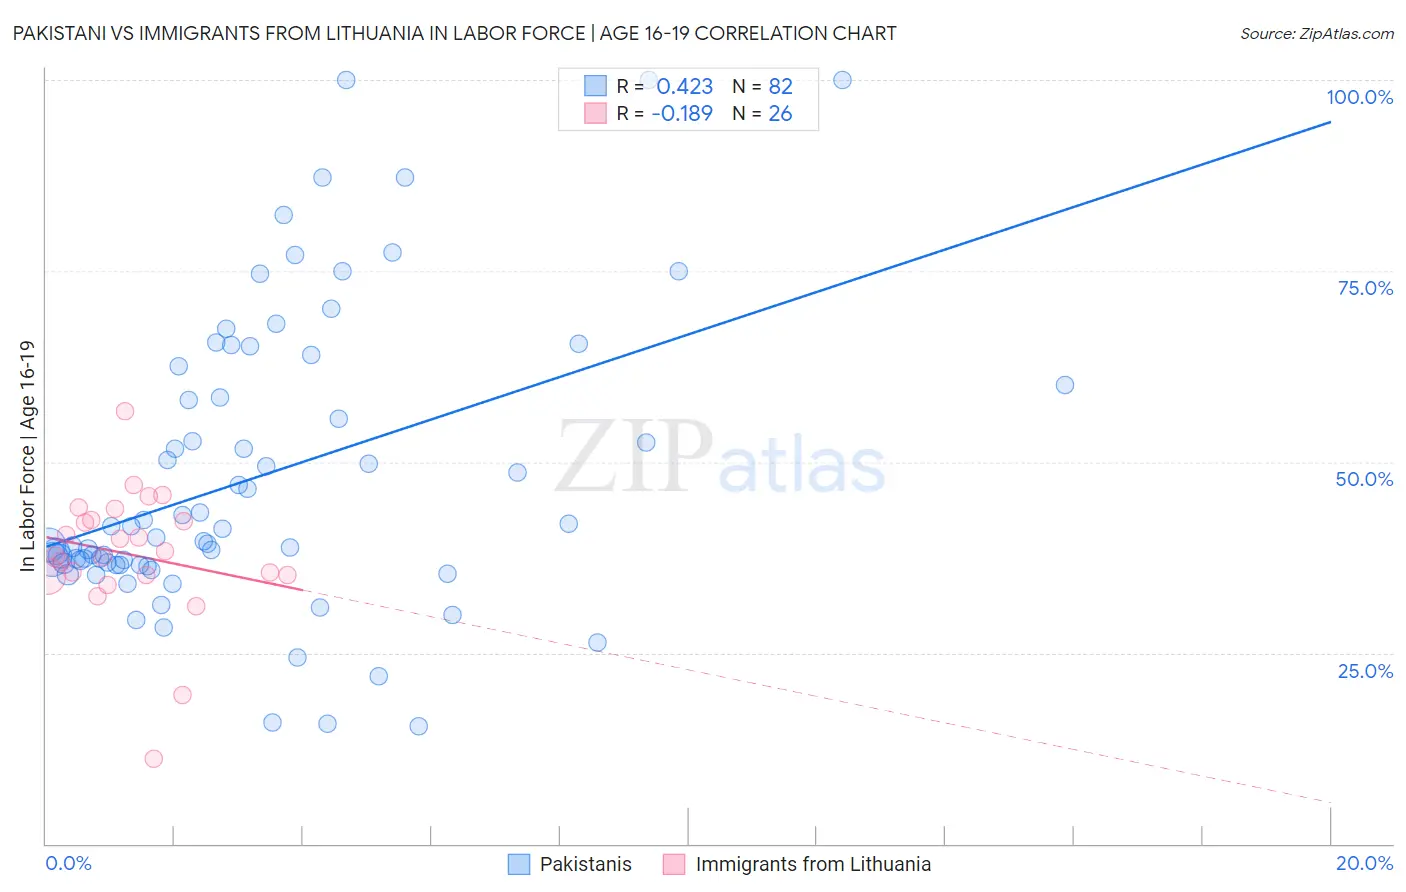
Pakistani vs Immigrants from Lithuania In Labor Force | Age 16-19 Correlation Chart
The statistical analysis conducted on geographies consisting of 335,000,628 people shows a moderate positive correlation between the proportion of Pakistanis and labor force participation rate among population between the ages 16 and 19 in the United States with a correlation coefficient (R) of 0.423 and weighted average of 37.6%. Similarly, the statistical analysis conducted on geographies consisting of 117,641,154 people shows a poor negative correlation between the proportion of Immigrants from Lithuania and labor force participation rate among population between the ages 16 and 19 in the United States with a correlation coefficient (R) of -0.189 and weighted average of 37.2%, a difference of 0.88%.
In Labor Force | Age 16-19 Correlation Summary
| Measurement | Pakistani | Immigrants from Lithuania |
| Minimum | 15.4% | 11.2% |
| Maximum | 100.0% | 56.7% |
| Range | 84.6% | 45.5% |
| Mean | 48.1% | 37.9% |
| Median | 40.7% | 37.9% |
| Interquartile 25% (IQ1) | 36.5% | 35.1% |
| Interquartile 75% (IQ3) | 60.0% | 42.5% |
| Interquartile Range (IQR) | 23.5% | 7.3% |
| Standard Deviation (Sample) | 19.2% | 8.7% |
| Standard Deviation (Population) | 19.1% | 8.5% |
Demographics Similar to Pakistanis and Immigrants from Lithuania by In Labor Force | Age 16-19
In terms of in labor force | age 16-19, the demographic groups most similar to Pakistanis are Japanese (37.5%, a difference of 0.020%), Paiute (37.5%, a difference of 0.020%), Sierra Leonean (37.6%, a difference of 0.030%), Immigrants from Western Europe (37.5%, a difference of 0.070%), and Brazilian (37.5%, a difference of 0.10%). Similarly, the demographic groups most similar to Immigrants from Lithuania are Kiowa (37.2%, a difference of 0.020%), Immigrants from Bulgaria (37.3%, a difference of 0.070%), Arapaho (37.3%, a difference of 0.090%), Immigrants from Sierra Leone (37.3%, a difference of 0.25%), and Immigrants from Brazil (37.1%, a difference of 0.31%).
| Demographics | Rating | Rank | In Labor Force | Age 16-19 |
| Immigrants | Moldova | 91.9 /100 | #139 | Exceptional 37.7% |
| Estonians | 91.7 /100 | #140 | Exceptional 37.7% |
| Syrians | 90.7 /100 | #141 | Exceptional 37.6% |
| Sierra Leoneans | 89.7 /100 | #142 | Excellent 37.6% |
| Pakistanis | 89.5 /100 | #143 | Excellent 37.6% |
| Japanese | 89.3 /100 | #144 | Excellent 37.5% |
| Paiute | 89.3 /100 | #145 | Excellent 37.5% |
| Immigrants | Western Europe | 88.9 /100 | #146 | Excellent 37.5% |
| Brazilians | 88.7 /100 | #147 | Excellent 37.5% |
| Romanians | 87.3 /100 | #148 | Excellent 37.5% |
| Native Hawaiians | 85.0 /100 | #149 | Excellent 37.4% |
| Tsimshian | 84.7 /100 | #150 | Excellent 37.4% |
| Immigrants | Poland | 84.4 /100 | #151 | Excellent 37.3% |
| Immigrants | Sierra Leone | 83.6 /100 | #152 | Excellent 37.3% |
| Arapaho | 81.8 /100 | #153 | Excellent 37.3% |
| Immigrants | Bulgaria | 81.6 /100 | #154 | Excellent 37.3% |
| Immigrants | Lithuania | 80.7 /100 | #155 | Excellent 37.2% |
| Kiowa | 80.4 /100 | #156 | Excellent 37.2% |
| Immigrants | Brazil | 76.5 /100 | #157 | Good 37.1% |
| Ute | 75.7 /100 | #158 | Good 37.1% |
| Yaqui | 74.4 /100 | #159 | Good 37.1% |