Immigrants from Afghanistan vs Slovak In Labor Force | Age 20-24
COMPARE
Immigrants from Afghanistan
Slovak
In Labor Force | Age 20-24
In Labor Force | Age 20-24 Comparison
Immigrants from Afghanistan
Slovaks
75.6%
IN LABOR FORCE | AGE 20-24
89.4/ 100
METRIC RATING
128th/ 347
METRIC RANK
77.7%
IN LABOR FORCE | AGE 20-24
100.0/ 100
METRIC RATING
29th/ 347
METRIC RANK
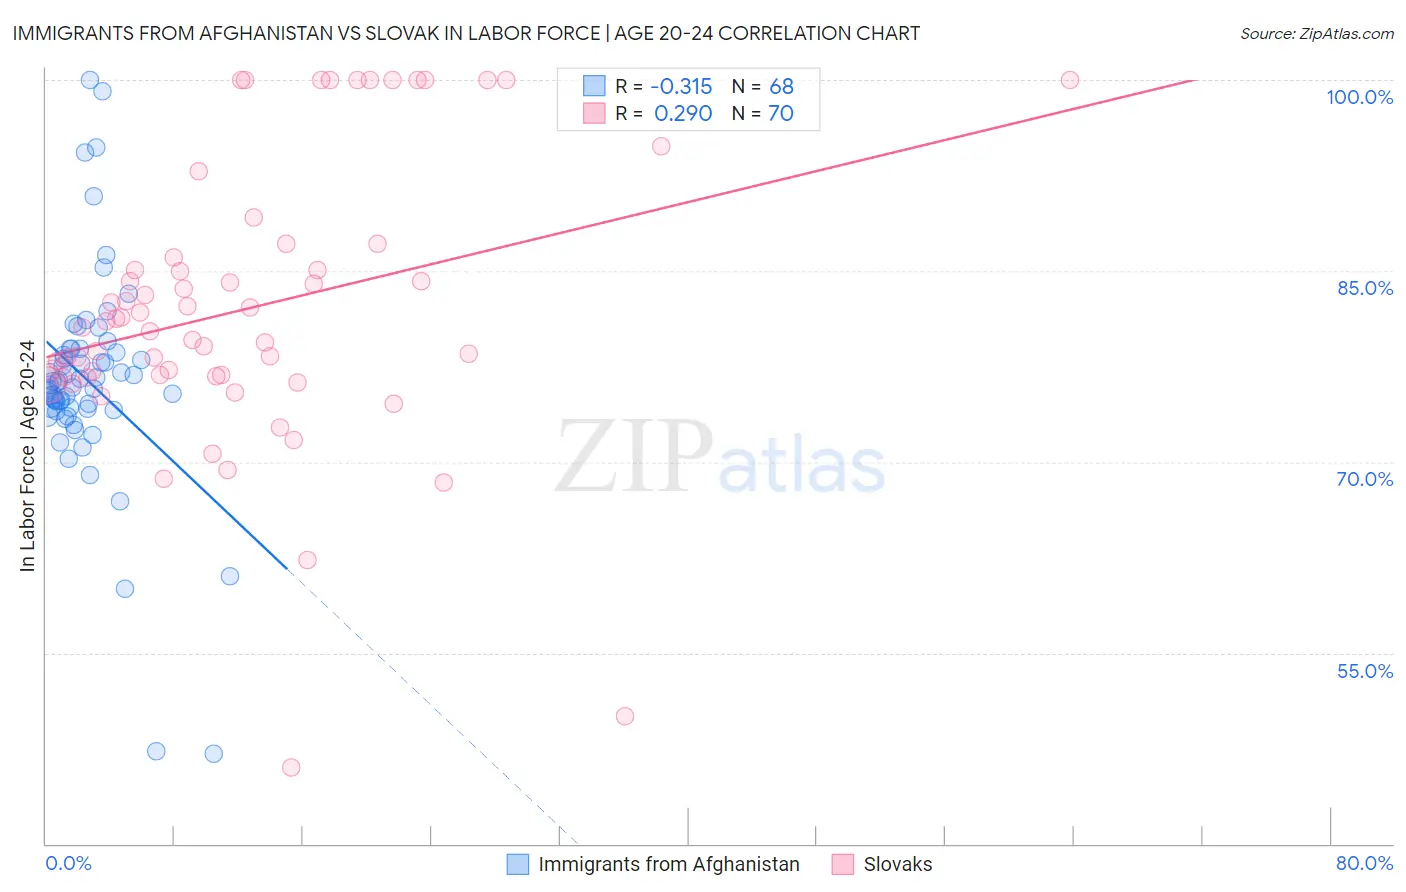
Immigrants from Afghanistan vs Slovak In Labor Force | Age 20-24 Correlation Chart
The statistical analysis conducted on geographies consisting of 147,610,096 people shows a mild negative correlation between the proportion of Immigrants from Afghanistan and labor force participation rate among population between the ages 20 and 24 in the United States with a correlation coefficient (R) of -0.315 and weighted average of 75.6%. Similarly, the statistical analysis conducted on geographies consisting of 397,601,730 people shows a weak positive correlation between the proportion of Slovaks and labor force participation rate among population between the ages 20 and 24 in the United States with a correlation coefficient (R) of 0.290 and weighted average of 77.7%, a difference of 2.8%.
In Labor Force | Age 20-24 Correlation Summary
| Measurement | Immigrants from Afghanistan | Slovak |
| Minimum | 47.1% | 46.0% |
| Maximum | 100.0% | 100.0% |
| Range | 52.9% | 54.0% |
| Mean | 76.4% | 82.1% |
| Median | 76.2% | 80.8% |
| Interquartile 25% (IQ1) | 74.2% | 76.7% |
| Interquartile 75% (IQ3) | 78.7% | 86.0% |
| Interquartile Range (IQR) | 4.6% | 9.3% |
| Standard Deviation (Sample) | 8.5% | 11.1% |
| Standard Deviation (Population) | 8.5% | 11.0% |
Similar Demographics by In Labor Force | Age 20-24
Demographics Similar to Immigrants from Afghanistan by In Labor Force | Age 20-24
In terms of in labor force | age 20-24, the demographic groups most similar to Immigrants from Afghanistan are Iroquois (75.6%, a difference of 0.010%), Immigrants from Austria (75.6%, a difference of 0.020%), Immigrants from Jordan (75.6%, a difference of 0.030%), Palestinian (75.6%, a difference of 0.040%), and Zimbabwean (75.6%, a difference of 0.040%).
| Demographics | Rating | Rank | In Labor Force | Age 20-24 |
| Immigrants | Serbia | 94.3 /100 | #121 | Exceptional 75.8% |
| Pakistanis | 94.1 /100 | #122 | Exceptional 75.8% |
| Immigrants | Bulgaria | 94.1 /100 | #123 | Exceptional 75.8% |
| Immigrants | Sierra Leone | 93.8 /100 | #124 | Exceptional 75.8% |
| Immigrants | Scotland | 93.7 /100 | #125 | Exceptional 75.8% |
| Brazilians | 93.0 /100 | #126 | Exceptional 75.8% |
| Sub-Saharan Africans | 90.9 /100 | #127 | Exceptional 75.7% |
| Immigrants | Afghanistan | 89.4 /100 | #128 | Excellent 75.6% |
| Iroquois | 89.1 /100 | #129 | Excellent 75.6% |
| Immigrants | Austria | 88.8 /100 | #130 | Excellent 75.6% |
| Immigrants | Jordan | 88.5 /100 | #131 | Excellent 75.6% |
| Palestinians | 88.4 /100 | #132 | Excellent 75.6% |
| Zimbabweans | 88.2 /100 | #133 | Excellent 75.6% |
| Estonians | 87.1 /100 | #134 | Excellent 75.6% |
| Yaqui | 85.5 /100 | #135 | Excellent 75.5% |
Demographics Similar to Slovaks by In Labor Force | Age 20-24
In terms of in labor force | age 20-24, the demographic groups most similar to Slovaks are Swiss (77.7%, a difference of 0.020%), Belgian (77.8%, a difference of 0.090%), Immigrants from Micronesia (77.8%, a difference of 0.12%), Polish (77.6%, a difference of 0.14%), and English (77.6%, a difference of 0.20%).
| Demographics | Rating | Rank | In Labor Force | Age 20-24 |
| Pennsylvania Germans | 100.0 /100 | #22 | Exceptional 78.0% |
| Yugoslavians | 100.0 /100 | #23 | Exceptional 78.0% |
| Liberians | 100.0 /100 | #24 | Exceptional 78.0% |
| Tlingit-Haida | 100.0 /100 | #25 | Exceptional 77.9% |
| Tongans | 100.0 /100 | #26 | Exceptional 77.9% |
| Immigrants | Micronesia | 100.0 /100 | #27 | Exceptional 77.8% |
| Belgians | 100.0 /100 | #28 | Exceptional 77.8% |
| Slovaks | 100.0 /100 | #29 | Exceptional 77.7% |
| Swiss | 100.0 /100 | #30 | Exceptional 77.7% |
| Poles | 100.0 /100 | #31 | Exceptional 77.6% |
| English | 100.0 /100 | #32 | Exceptional 77.6% |
| Immigrants | Ethiopia | 100.0 /100 | #33 | Exceptional 77.5% |
| German Russians | 100.0 /100 | #34 | Exceptional 77.5% |
| Immigrants | Eastern Africa | 100.0 /100 | #35 | Exceptional 77.5% |
| Welsh | 100.0 /100 | #36 | Exceptional 77.5% |