Immigrants from Chile vs Slovak In Labor Force | Age 20-24
COMPARE
Immigrants from Chile
Slovak
In Labor Force | Age 20-24
In Labor Force | Age 20-24 Comparison
Immigrants from Chile
Slovaks
74.1%
IN LABOR FORCE | AGE 20-24
3.7/ 100
METRIC RATING
233rd/ 347
METRIC RANK
77.7%
IN LABOR FORCE | AGE 20-24
100.0/ 100
METRIC RATING
29th/ 347
METRIC RANK
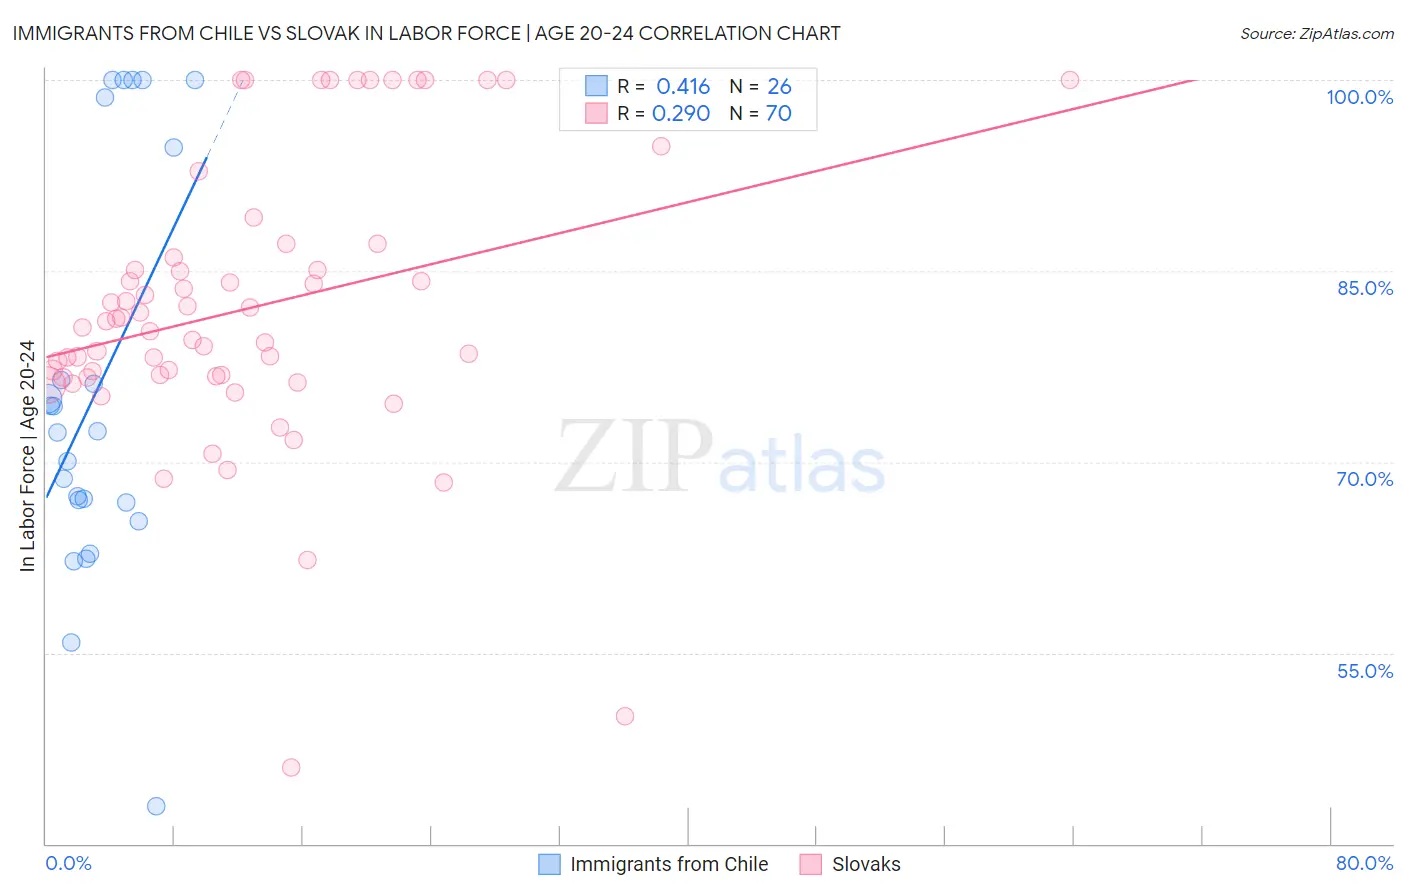
Immigrants from Chile vs Slovak In Labor Force | Age 20-24 Correlation Chart
The statistical analysis conducted on geographies consisting of 218,628,779 people shows a moderate positive correlation between the proportion of Immigrants from Chile and labor force participation rate among population between the ages 20 and 24 in the United States with a correlation coefficient (R) of 0.416 and weighted average of 74.1%. Similarly, the statistical analysis conducted on geographies consisting of 397,601,730 people shows a weak positive correlation between the proportion of Slovaks and labor force participation rate among population between the ages 20 and 24 in the United States with a correlation coefficient (R) of 0.290 and weighted average of 77.7%, a difference of 4.8%.
In Labor Force | Age 20-24 Correlation Summary
| Measurement | Immigrants from Chile | Slovak |
| Minimum | 42.9% | 46.0% |
| Maximum | 100.0% | 100.0% |
| Range | 57.1% | 54.0% |
| Mean | 75.9% | 82.1% |
| Median | 72.4% | 80.8% |
| Interquartile 25% (IQ1) | 66.8% | 76.7% |
| Interquartile 75% (IQ3) | 94.7% | 86.0% |
| Interquartile Range (IQR) | 27.9% | 9.3% |
| Standard Deviation (Sample) | 15.9% | 11.1% |
| Standard Deviation (Population) | 15.6% | 11.0% |
Similar Demographics by In Labor Force | Age 20-24
Demographics Similar to Immigrants from Chile by In Labor Force | Age 20-24
In terms of in labor force | age 20-24, the demographic groups most similar to Immigrants from Chile are Immigrants (74.1%, a difference of 0.010%), Laotian (74.1%, a difference of 0.020%), Immigrants from Switzerland (74.2%, a difference of 0.040%), Immigrants from France (74.1%, a difference of 0.040%), and Immigrants from Greece (74.2%, a difference of 0.050%).
| Demographics | Rating | Rank | In Labor Force | Age 20-24 |
| Immigrants | Fiji | 5.9 /100 | #226 | Tragic 74.3% |
| Immigrants | Ireland | 5.8 /100 | #227 | Tragic 74.3% |
| Immigrants | Ukraine | 5.1 /100 | #228 | Tragic 74.2% |
| Immigrants | Sweden | 4.6 /100 | #229 | Tragic 74.2% |
| Immigrants | Albania | 4.3 /100 | #230 | Tragic 74.2% |
| Immigrants | Greece | 4.1 /100 | #231 | Tragic 74.2% |
| Immigrants | Switzerland | 4.1 /100 | #232 | Tragic 74.2% |
| Immigrants | Chile | 3.7 /100 | #233 | Tragic 74.1% |
| Immigrants | Immigrants | 3.6 /100 | #234 | Tragic 74.1% |
| Laotians | 3.5 /100 | #235 | Tragic 74.1% |
| Immigrants | France | 3.3 /100 | #236 | Tragic 74.1% |
| Bermudans | 3.2 /100 | #237 | Tragic 74.1% |
| Immigrants | Japan | 3.0 /100 | #238 | Tragic 74.1% |
| Immigrants | Latin America | 2.7 /100 | #239 | Tragic 74.1% |
| Immigrants | Sri Lanka | 2.3 /100 | #240 | Tragic 74.0% |
Demographics Similar to Slovaks by In Labor Force | Age 20-24
In terms of in labor force | age 20-24, the demographic groups most similar to Slovaks are Swiss (77.7%, a difference of 0.020%), Belgian (77.8%, a difference of 0.090%), Immigrants from Micronesia (77.8%, a difference of 0.12%), Polish (77.6%, a difference of 0.14%), and English (77.6%, a difference of 0.20%).
| Demographics | Rating | Rank | In Labor Force | Age 20-24 |
| Pennsylvania Germans | 100.0 /100 | #22 | Exceptional 78.0% |
| Yugoslavians | 100.0 /100 | #23 | Exceptional 78.0% |
| Liberians | 100.0 /100 | #24 | Exceptional 78.0% |
| Tlingit-Haida | 100.0 /100 | #25 | Exceptional 77.9% |
| Tongans | 100.0 /100 | #26 | Exceptional 77.9% |
| Immigrants | Micronesia | 100.0 /100 | #27 | Exceptional 77.8% |
| Belgians | 100.0 /100 | #28 | Exceptional 77.8% |
| Slovaks | 100.0 /100 | #29 | Exceptional 77.7% |
| Swiss | 100.0 /100 | #30 | Exceptional 77.7% |
| Poles | 100.0 /100 | #31 | Exceptional 77.6% |
| English | 100.0 /100 | #32 | Exceptional 77.6% |
| Immigrants | Ethiopia | 100.0 /100 | #33 | Exceptional 77.5% |
| German Russians | 100.0 /100 | #34 | Exceptional 77.5% |
| Immigrants | Eastern Africa | 100.0 /100 | #35 | Exceptional 77.5% |
| Welsh | 100.0 /100 | #36 | Exceptional 77.5% |