Immigrants from Poland vs Slovak In Labor Force | Age 20-24
COMPARE
Immigrants from Poland
Slovak
In Labor Force | Age 20-24
In Labor Force | Age 20-24 Comparison
Immigrants from Poland
Slovaks
76.1%
IN LABOR FORCE | AGE 20-24
97.7/ 100
METRIC RATING
101st/ 347
METRIC RANK
77.7%
IN LABOR FORCE | AGE 20-24
100.0/ 100
METRIC RATING
29th/ 347
METRIC RANK
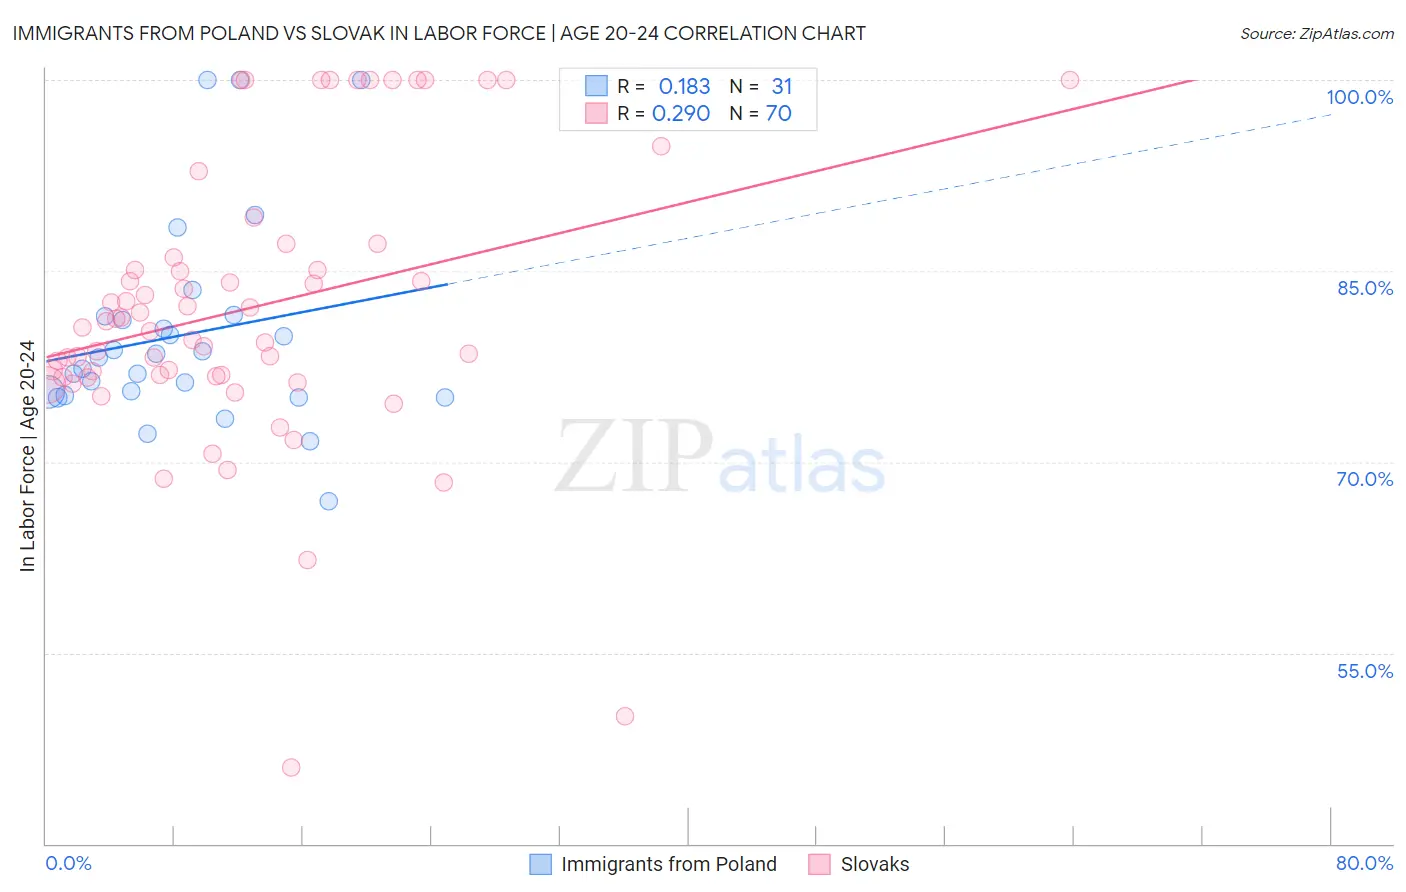
Immigrants from Poland vs Slovak In Labor Force | Age 20-24 Correlation Chart
The statistical analysis conducted on geographies consisting of 304,736,963 people shows a poor positive correlation between the proportion of Immigrants from Poland and labor force participation rate among population between the ages 20 and 24 in the United States with a correlation coefficient (R) of 0.183 and weighted average of 76.1%. Similarly, the statistical analysis conducted on geographies consisting of 397,601,730 people shows a weak positive correlation between the proportion of Slovaks and labor force participation rate among population between the ages 20 and 24 in the United States with a correlation coefficient (R) of 0.290 and weighted average of 77.7%, a difference of 2.1%.
In Labor Force | Age 20-24 Correlation Summary
| Measurement | Immigrants from Poland | Slovak |
| Minimum | 66.9% | 46.0% |
| Maximum | 100.0% | 100.0% |
| Range | 33.1% | 54.0% |
| Mean | 80.0% | 82.1% |
| Median | 78.2% | 80.8% |
| Interquartile 25% (IQ1) | 75.2% | 76.7% |
| Interquartile 75% (IQ3) | 81.5% | 86.0% |
| Interquartile Range (IQR) | 6.3% | 9.3% |
| Standard Deviation (Sample) | 8.0% | 11.1% |
| Standard Deviation (Population) | 7.9% | 11.0% |
Similar Demographics by In Labor Force | Age 20-24
Demographics Similar to Immigrants from Poland by In Labor Force | Age 20-24
In terms of in labor force | age 20-24, the demographic groups most similar to Immigrants from Poland are Latvian (76.1%, a difference of 0.010%), American (76.1%, a difference of 0.020%), Shoshone (76.1%, a difference of 0.020%), Immigrants from North Macedonia (76.1%, a difference of 0.030%), and Immigrants from Lithuania (76.1%, a difference of 0.050%).
| Demographics | Rating | Rank | In Labor Force | Age 20-24 |
| Potawatomi | 98.5 /100 | #94 | Exceptional 76.2% |
| Immigrants | Germany | 98.5 /100 | #95 | Exceptional 76.2% |
| Immigrants | Nonimmigrants | 98.5 /100 | #96 | Exceptional 76.2% |
| Immigrants | Lithuania | 98.0 /100 | #97 | Exceptional 76.1% |
| Immigrants | Oceania | 98.0 /100 | #98 | Exceptional 76.1% |
| Americans | 97.8 /100 | #99 | Exceptional 76.1% |
| Shoshone | 97.8 /100 | #100 | Exceptional 76.1% |
| Immigrants | Poland | 97.7 /100 | #101 | Exceptional 76.1% |
| Latvians | 97.6 /100 | #102 | Exceptional 76.1% |
| Immigrants | North Macedonia | 97.5 /100 | #103 | Exceptional 76.1% |
| Macedonians | 97.2 /100 | #104 | Exceptional 76.0% |
| Immigrants | Nepal | 97.2 /100 | #105 | Exceptional 76.0% |
| Immigrants | Uganda | 97.1 /100 | #106 | Exceptional 76.0% |
| Greeks | 96.9 /100 | #107 | Exceptional 76.0% |
| Iraqis | 96.6 /100 | #108 | Exceptional 76.0% |
Demographics Similar to Slovaks by In Labor Force | Age 20-24
In terms of in labor force | age 20-24, the demographic groups most similar to Slovaks are Swiss (77.7%, a difference of 0.020%), Belgian (77.8%, a difference of 0.090%), Immigrants from Micronesia (77.8%, a difference of 0.12%), Polish (77.6%, a difference of 0.14%), and English (77.6%, a difference of 0.20%).
| Demographics | Rating | Rank | In Labor Force | Age 20-24 |
| Pennsylvania Germans | 100.0 /100 | #22 | Exceptional 78.0% |
| Yugoslavians | 100.0 /100 | #23 | Exceptional 78.0% |
| Liberians | 100.0 /100 | #24 | Exceptional 78.0% |
| Tlingit-Haida | 100.0 /100 | #25 | Exceptional 77.9% |
| Tongans | 100.0 /100 | #26 | Exceptional 77.9% |
| Immigrants | Micronesia | 100.0 /100 | #27 | Exceptional 77.8% |
| Belgians | 100.0 /100 | #28 | Exceptional 77.8% |
| Slovaks | 100.0 /100 | #29 | Exceptional 77.7% |
| Swiss | 100.0 /100 | #30 | Exceptional 77.7% |
| Poles | 100.0 /100 | #31 | Exceptional 77.6% |
| English | 100.0 /100 | #32 | Exceptional 77.6% |
| Immigrants | Ethiopia | 100.0 /100 | #33 | Exceptional 77.5% |
| German Russians | 100.0 /100 | #34 | Exceptional 77.5% |
| Immigrants | Eastern Africa | 100.0 /100 | #35 | Exceptional 77.5% |
| Welsh | 100.0 /100 | #36 | Exceptional 77.5% |