Ottawa vs Nigerian In Labor Force | Age 20-24
COMPARE
Ottawa
Nigerian
In Labor Force | Age 20-24
In Labor Force | Age 20-24 Comparison
Ottawa
Nigerians
76.8%
IN LABOR FORCE | AGE 20-24
99.8/ 100
METRIC RATING
70th/ 347
METRIC RANK
74.7%
IN LABOR FORCE | AGE 20-24
21.9/ 100
METRIC RATING
200th/ 347
METRIC RANK
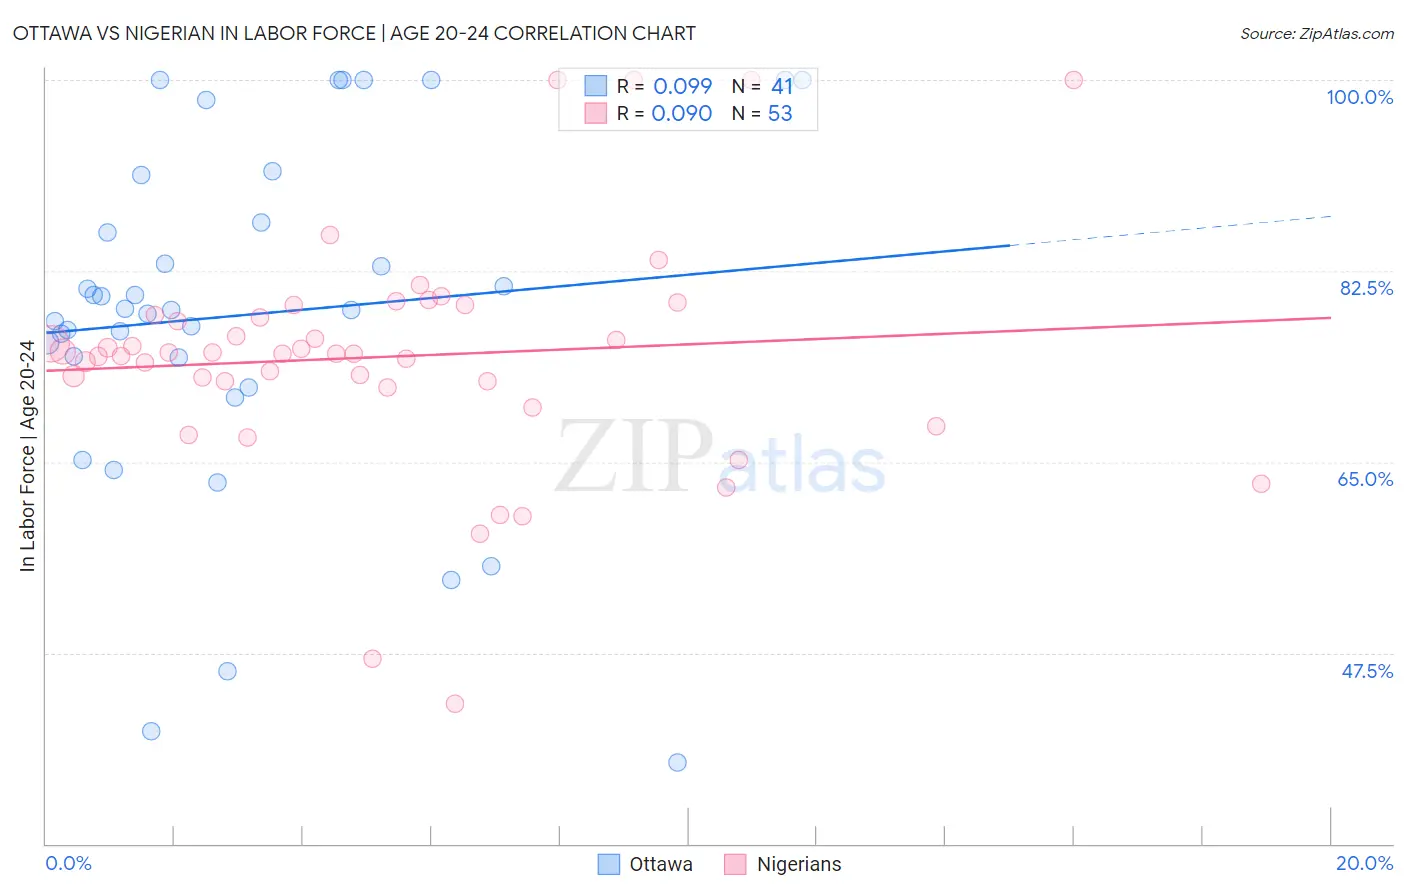
Ottawa vs Nigerian In Labor Force | Age 20-24 Correlation Chart
The statistical analysis conducted on geographies consisting of 49,950,403 people shows a slight positive correlation between the proportion of Ottawa and labor force participation rate among population between the ages 20 and 24 in the United States with a correlation coefficient (R) of 0.099 and weighted average of 76.8%. Similarly, the statistical analysis conducted on geographies consisting of 332,759,709 people shows a slight positive correlation between the proportion of Nigerians and labor force participation rate among population between the ages 20 and 24 in the United States with a correlation coefficient (R) of 0.090 and weighted average of 74.7%, a difference of 2.8%.
In Labor Force | Age 20-24 Correlation Summary
| Measurement | Ottawa | Nigerian |
| Minimum | 37.5% | 42.8% |
| Maximum | 100.0% | 100.0% |
| Range | 62.5% | 57.2% |
| Mean | 78.5% | 74.7% |
| Median | 78.9% | 74.9% |
| Interquartile 25% (IQ1) | 73.2% | 72.1% |
| Interquartile 75% (IQ3) | 89.1% | 78.9% |
| Interquartile Range (IQR) | 15.9% | 6.8% |
| Standard Deviation (Sample) | 16.0% | 10.8% |
| Standard Deviation (Population) | 15.8% | 10.7% |
Similar Demographics by In Labor Force | Age 20-24
Demographics Similar to Ottawa by In Labor Force | Age 20-24
In terms of in labor force | age 20-24, the demographic groups most similar to Ottawa are Immigrants from Sudan (76.8%, a difference of 0.010%), French American Indian (76.8%, a difference of 0.030%), Slavic (76.9%, a difference of 0.060%), Icelander (76.9%, a difference of 0.070%), and Northern European (76.8%, a difference of 0.070%).
| Demographics | Rating | Rank | In Labor Force | Age 20-24 |
| Lithuanians | 99.9 /100 | #63 | Exceptional 77.0% |
| Whites/Caucasians | 99.9 /100 | #64 | Exceptional 76.9% |
| Crow | 99.9 /100 | #65 | Exceptional 76.9% |
| Icelanders | 99.9 /100 | #66 | Exceptional 76.9% |
| Slavs | 99.9 /100 | #67 | Exceptional 76.9% |
| French American Indians | 99.8 /100 | #68 | Exceptional 76.8% |
| Immigrants | Sudan | 99.8 /100 | #69 | Exceptional 76.8% |
| Ottawa | 99.8 /100 | #70 | Exceptional 76.8% |
| Northern Europeans | 99.8 /100 | #71 | Exceptional 76.8% |
| Guamanians/Chamorros | 99.8 /100 | #72 | Exceptional 76.7% |
| British | 99.8 /100 | #73 | Exceptional 76.7% |
| Cree | 99.7 /100 | #74 | Exceptional 76.6% |
| Immigrants | Middle Africa | 99.7 /100 | #75 | Exceptional 76.6% |
| Immigrants | Moldova | 99.6 /100 | #76 | Exceptional 76.6% |
| Immigrants | Cameroon | 99.6 /100 | #77 | Exceptional 76.6% |
Demographics Similar to Nigerians by In Labor Force | Age 20-24
In terms of in labor force | age 20-24, the demographic groups most similar to Nigerians are Choctaw (74.7%, a difference of 0.010%), Taiwanese (74.7%, a difference of 0.030%), Moroccan (74.7%, a difference of 0.030%), Immigrants from Nigeria (74.7%, a difference of 0.050%), and Panamanian (74.7%, a difference of 0.060%).
| Demographics | Rating | Rank | In Labor Force | Age 20-24 |
| Alsatians | 27.1 /100 | #193 | Fair 74.8% |
| Immigrants | Denmark | 25.8 /100 | #194 | Fair 74.8% |
| Eastern Europeans | 25.4 /100 | #195 | Fair 74.8% |
| Immigrants | Vietnam | 25.1 /100 | #196 | Fair 74.7% |
| Panamanians | 25.0 /100 | #197 | Fair 74.7% |
| Immigrants | Nigeria | 24.2 /100 | #198 | Fair 74.7% |
| Taiwanese | 23.2 /100 | #199 | Fair 74.7% |
| Nigerians | 21.9 /100 | #200 | Fair 74.7% |
| Choctaw | 21.4 /100 | #201 | Fair 74.7% |
| Moroccans | 20.4 /100 | #202 | Fair 74.7% |
| Immigrants | Northern Africa | 17.9 /100 | #203 | Poor 74.6% |
| Immigrants | Italy | 17.6 /100 | #204 | Poor 74.6% |
| Inupiat | 17.6 /100 | #205 | Poor 74.6% |
| Sioux | 17.5 /100 | #206 | Poor 74.6% |
| Albanians | 16.2 /100 | #207 | Poor 74.6% |