Guatemalan vs Slovak In Labor Force | Age 20-24
COMPARE
Guatemalan
Slovak
In Labor Force | Age 20-24
In Labor Force | Age 20-24 Comparison
Guatemalans
Slovaks
75.3%
IN LABOR FORCE | AGE 20-24
72.3/ 100
METRIC RATING
153rd/ 347
METRIC RANK
77.7%
IN LABOR FORCE | AGE 20-24
100.0/ 100
METRIC RATING
29th/ 347
METRIC RANK
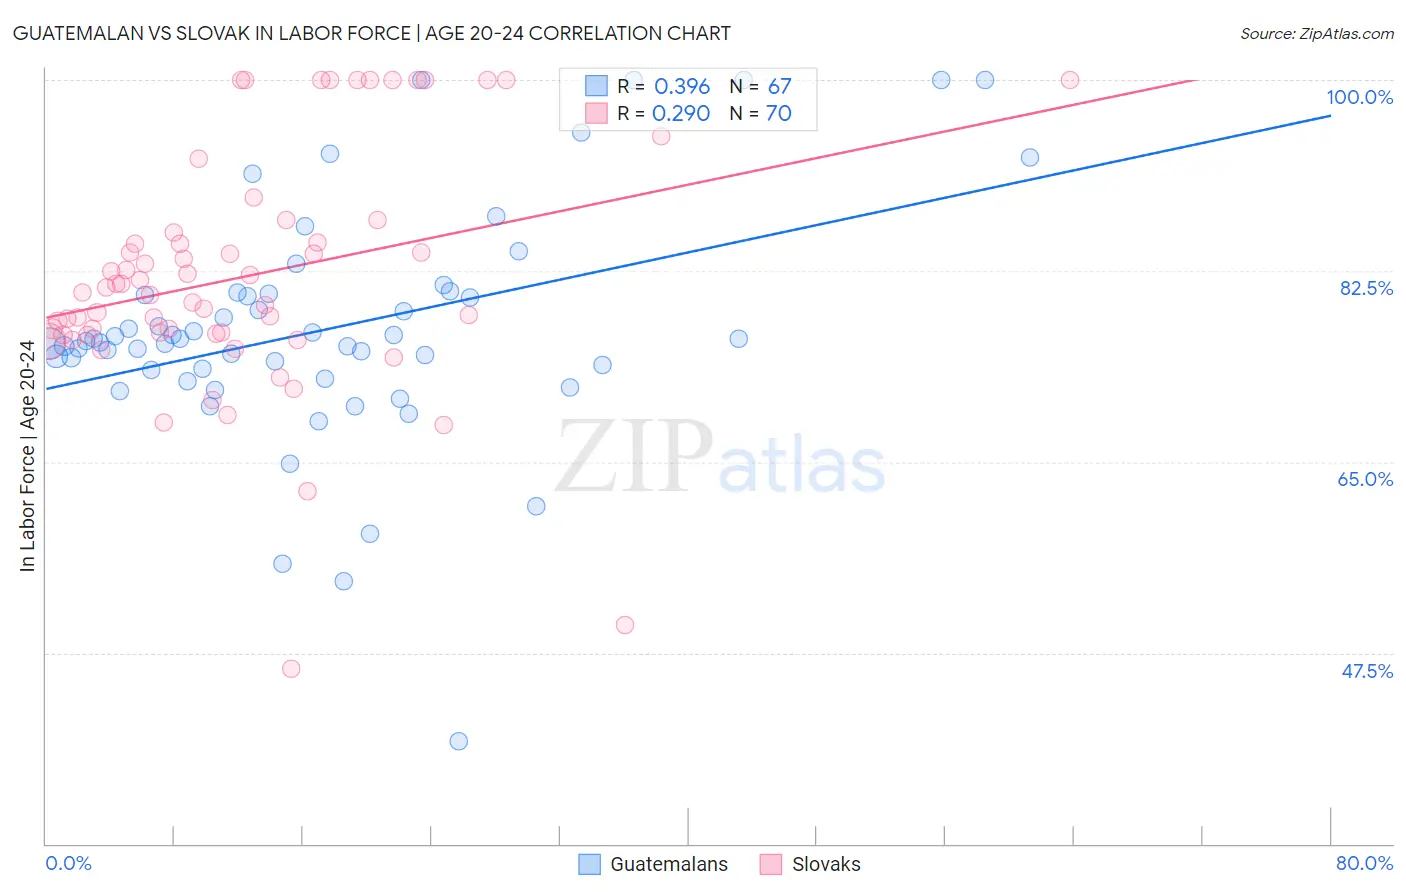
Guatemalan vs Slovak In Labor Force | Age 20-24 Correlation Chart
The statistical analysis conducted on geographies consisting of 409,475,190 people shows a mild positive correlation between the proportion of Guatemalans and labor force participation rate among population between the ages 20 and 24 in the United States with a correlation coefficient (R) of 0.396 and weighted average of 75.3%. Similarly, the statistical analysis conducted on geographies consisting of 397,601,730 people shows a weak positive correlation between the proportion of Slovaks and labor force participation rate among population between the ages 20 and 24 in the United States with a correlation coefficient (R) of 0.290 and weighted average of 77.7%, a difference of 3.2%.
In Labor Force | Age 20-24 Correlation Summary
| Measurement | Guatemalan | Slovak |
| Minimum | 39.4% | 46.0% |
| Maximum | 100.0% | 100.0% |
| Range | 60.6% | 54.0% |
| Mean | 77.2% | 82.1% |
| Median | 76.1% | 80.8% |
| Interquartile 25% (IQ1) | 73.4% | 76.7% |
| Interquartile 75% (IQ3) | 80.4% | 86.0% |
| Interquartile Range (IQR) | 7.0% | 9.3% |
| Standard Deviation (Sample) | 10.8% | 11.1% |
| Standard Deviation (Population) | 10.7% | 11.0% |
Similar Demographics by In Labor Force | Age 20-24
Demographics Similar to Guatemalans by In Labor Force | Age 20-24
In terms of in labor force | age 20-24, the demographic groups most similar to Guatemalans are Osage (75.3%, a difference of 0.0%), Immigrants from Guatemala (75.3%, a difference of 0.010%), Immigrants from El Salvador (75.3%, a difference of 0.010%), Immigrants from Western Europe (75.3%, a difference of 0.010%), and Lebanese (75.3%, a difference of 0.020%).
| Demographics | Rating | Rank | In Labor Force | Age 20-24 |
| Mexican American Indians | 78.8 /100 | #146 | Good 75.4% |
| Comanche | 77.6 /100 | #147 | Good 75.4% |
| Immigrants | Cambodia | 76.7 /100 | #148 | Good 75.4% |
| Ugandans | 76.1 /100 | #149 | Good 75.4% |
| Salvadorans | 74.8 /100 | #150 | Good 75.3% |
| Paiute | 74.1 /100 | #151 | Good 75.3% |
| Lebanese | 73.5 /100 | #152 | Good 75.3% |
| Guatemalans | 72.3 /100 | #153 | Good 75.3% |
| Osage | 72.3 /100 | #154 | Good 75.3% |
| Immigrants | Guatemala | 71.9 /100 | #155 | Good 75.3% |
| Immigrants | El Salvador | 71.7 /100 | #156 | Good 75.3% |
| Immigrants | Western Europe | 71.5 /100 | #157 | Good 75.3% |
| Immigrants | Bolivia | 71.0 /100 | #158 | Good 75.3% |
| South American Indians | 69.0 /100 | #159 | Good 75.3% |
| Japanese | 68.7 /100 | #160 | Good 75.3% |
Demographics Similar to Slovaks by In Labor Force | Age 20-24
In terms of in labor force | age 20-24, the demographic groups most similar to Slovaks are Swiss (77.7%, a difference of 0.020%), Belgian (77.8%, a difference of 0.090%), Immigrants from Micronesia (77.8%, a difference of 0.12%), Polish (77.6%, a difference of 0.14%), and English (77.6%, a difference of 0.20%).
| Demographics | Rating | Rank | In Labor Force | Age 20-24 |
| Pennsylvania Germans | 100.0 /100 | #22 | Exceptional 78.0% |
| Yugoslavians | 100.0 /100 | #23 | Exceptional 78.0% |
| Liberians | 100.0 /100 | #24 | Exceptional 78.0% |
| Tlingit-Haida | 100.0 /100 | #25 | Exceptional 77.9% |
| Tongans | 100.0 /100 | #26 | Exceptional 77.9% |
| Immigrants | Micronesia | 100.0 /100 | #27 | Exceptional 77.8% |
| Belgians | 100.0 /100 | #28 | Exceptional 77.8% |
| Slovaks | 100.0 /100 | #29 | Exceptional 77.7% |
| Swiss | 100.0 /100 | #30 | Exceptional 77.7% |
| Poles | 100.0 /100 | #31 | Exceptional 77.6% |
| English | 100.0 /100 | #32 | Exceptional 77.6% |
| Immigrants | Ethiopia | 100.0 /100 | #33 | Exceptional 77.5% |
| German Russians | 100.0 /100 | #34 | Exceptional 77.5% |
| Immigrants | Eastern Africa | 100.0 /100 | #35 | Exceptional 77.5% |
| Welsh | 100.0 /100 | #36 | Exceptional 77.5% |