Immigrants from Liberia vs Belizean In Labor Force | Age 35-44
COMPARE
Immigrants from Liberia
Belizean
In Labor Force | Age 35-44
In Labor Force | Age 35-44 Comparison
Immigrants from Liberia
Belizeans
85.4%
IN LABOR FORCE | AGE 35-44
99.9/ 100
METRIC RATING
26th/ 347
METRIC RANK
83.1%
IN LABOR FORCE | AGE 35-44
0.0/ 100
METRIC RATING
278th/ 347
METRIC RANK
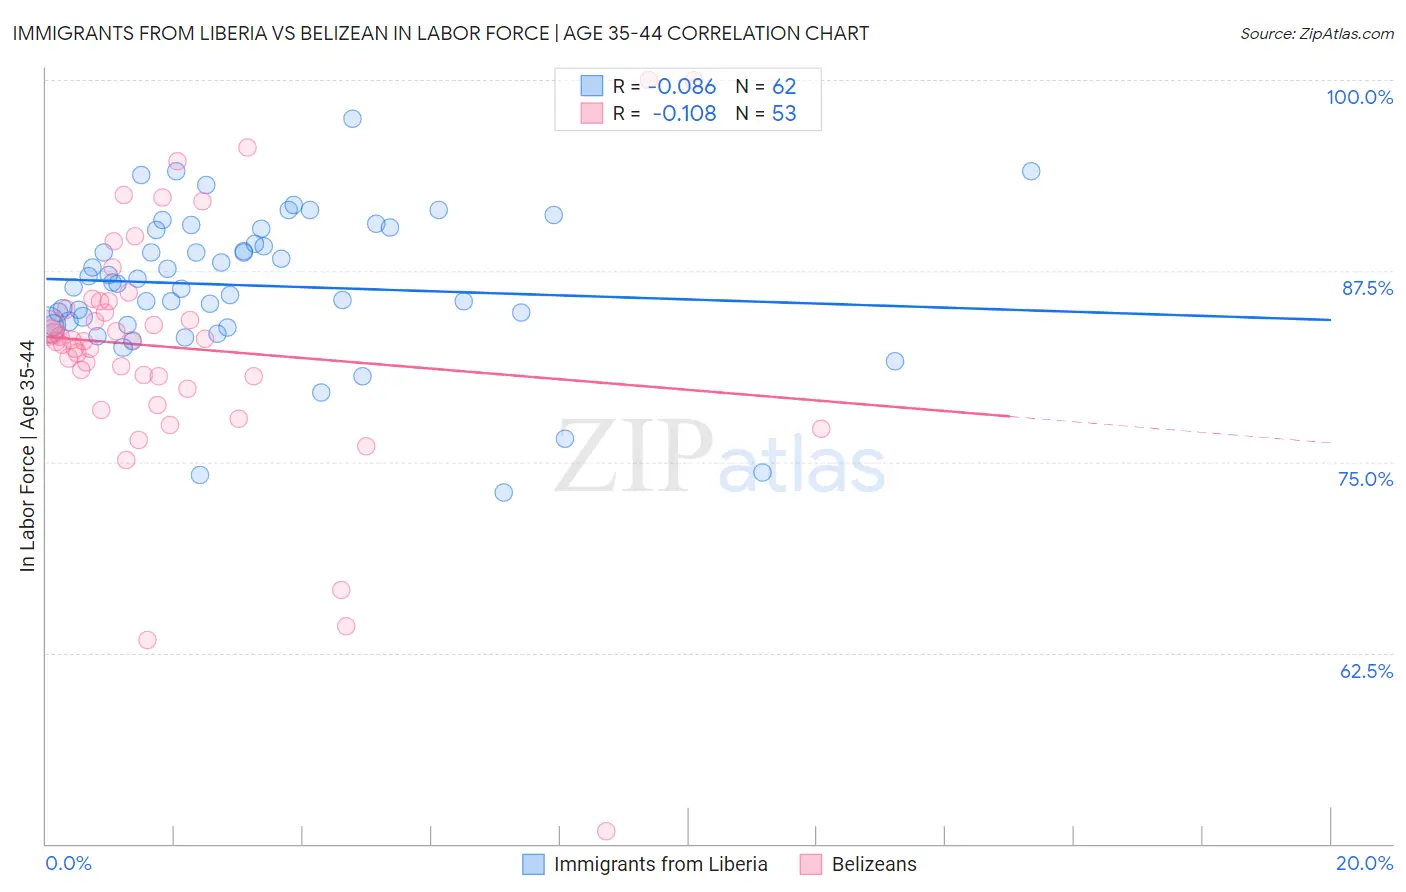
Immigrants from Liberia vs Belizean In Labor Force | Age 35-44 Correlation Chart
The statistical analysis conducted on geographies consisting of 135,260,455 people shows a slight negative correlation between the proportion of Immigrants from Liberia and labor force participation rate among population between the ages 35 and 44 in the United States with a correlation coefficient (R) of -0.086 and weighted average of 85.4%. Similarly, the statistical analysis conducted on geographies consisting of 144,190,758 people shows a poor negative correlation between the proportion of Belizeans and labor force participation rate among population between the ages 35 and 44 in the United States with a correlation coefficient (R) of -0.108 and weighted average of 83.1%, a difference of 2.7%.
In Labor Force | Age 35-44 Correlation Summary
| Measurement | Immigrants from Liberia | Belizean |
| Minimum | 73.0% | 50.8% |
| Maximum | 97.5% | 100.0% |
| Range | 24.5% | 49.2% |
| Mean | 86.5% | 82.5% |
| Median | 86.7% | 83.0% |
| Interquartile 25% (IQ1) | 84.0% | 80.2% |
| Interquartile 75% (IQ3) | 90.2% | 85.5% |
| Interquartile Range (IQR) | 6.2% | 5.4% |
| Standard Deviation (Sample) | 4.8% | 8.4% |
| Standard Deviation (Population) | 4.8% | 8.3% |
Similar Demographics by In Labor Force | Age 35-44
Demographics Similar to Immigrants from Liberia by In Labor Force | Age 35-44
In terms of in labor force | age 35-44, the demographic groups most similar to Immigrants from Liberia are Paraguayan (85.4%, a difference of 0.0%), Immigrants from Lithuania (85.4%, a difference of 0.0%), Latvian (85.4%, a difference of 0.010%), Immigrants from Greece (85.3%, a difference of 0.020%), and Cambodian (85.3%, a difference of 0.050%).
| Demographics | Rating | Rank | In Labor Force | Age 35-44 |
| Slovenes | 100.0 /100 | #19 | Exceptional 85.6% |
| Immigrants | Serbia | 100.0 /100 | #20 | Exceptional 85.5% |
| Bulgarians | 100.0 /100 | #21 | Exceptional 85.5% |
| Immigrants | Bosnia and Herzegovina | 100.0 /100 | #22 | Exceptional 85.4% |
| Immigrants | Eastern Africa | 100.0 /100 | #23 | Exceptional 85.4% |
| Latvians | 99.9 /100 | #24 | Exceptional 85.4% |
| Paraguayans | 99.9 /100 | #25 | Exceptional 85.4% |
| Immigrants | Liberia | 99.9 /100 | #26 | Exceptional 85.4% |
| Immigrants | Lithuania | 99.9 /100 | #27 | Exceptional 85.4% |
| Immigrants | Greece | 99.9 /100 | #28 | Exceptional 85.3% |
| Cambodians | 99.9 /100 | #29 | Exceptional 85.3% |
| Bermudans | 99.9 /100 | #30 | Exceptional 85.3% |
| Czechs | 99.9 /100 | #31 | Exceptional 85.3% |
| Immigrants | India | 99.9 /100 | #32 | Exceptional 85.3% |
| Ugandans | 99.9 /100 | #33 | Exceptional 85.3% |
Demographics Similar to Belizeans by In Labor Force | Age 35-44
In terms of in labor force | age 35-44, the demographic groups most similar to Belizeans are Immigrants from Micronesia (83.1%, a difference of 0.010%), Dominican (83.1%, a difference of 0.050%), Samoan (83.2%, a difference of 0.070%), Delaware (83.2%, a difference of 0.080%), and Hawaiian (83.2%, a difference of 0.090%).
| Demographics | Rating | Rank | In Labor Force | Age 35-44 |
| French American Indians | 0.0 /100 | #271 | Tragic 83.2% |
| Immigrants | Fiji | 0.0 /100 | #272 | Tragic 83.2% |
| Spanish | 0.0 /100 | #273 | Tragic 83.2% |
| Immigrants | Nonimmigrants | 0.0 /100 | #274 | Tragic 83.2% |
| Hawaiians | 0.0 /100 | #275 | Tragic 83.2% |
| Delaware | 0.0 /100 | #276 | Tragic 83.2% |
| Samoans | 0.0 /100 | #277 | Tragic 83.2% |
| Belizeans | 0.0 /100 | #278 | Tragic 83.1% |
| Immigrants | Micronesia | 0.0 /100 | #279 | Tragic 83.1% |
| Dominicans | 0.0 /100 | #280 | Tragic 83.1% |
| Guatemalans | 0.0 /100 | #281 | Tragic 83.0% |
| Osage | 0.0 /100 | #282 | Tragic 82.9% |
| Immigrants | Guatemala | 0.0 /100 | #283 | Tragic 82.9% |
| Immigrants | Dominican Republic | 0.0 /100 | #284 | Tragic 82.9% |
| Fijians | 0.0 /100 | #285 | Tragic 82.9% |