Chickasaw vs Belizean In Labor Force | Age 35-44
COMPARE
Chickasaw
Belizean
In Labor Force | Age 35-44
In Labor Force | Age 35-44 Comparison
Chickasaw
Belizeans
80.9%
IN LABOR FORCE | AGE 35-44
0.0/ 100
METRIC RATING
320th/ 347
METRIC RANK
83.1%
IN LABOR FORCE | AGE 35-44
0.0/ 100
METRIC RATING
278th/ 347
METRIC RANK
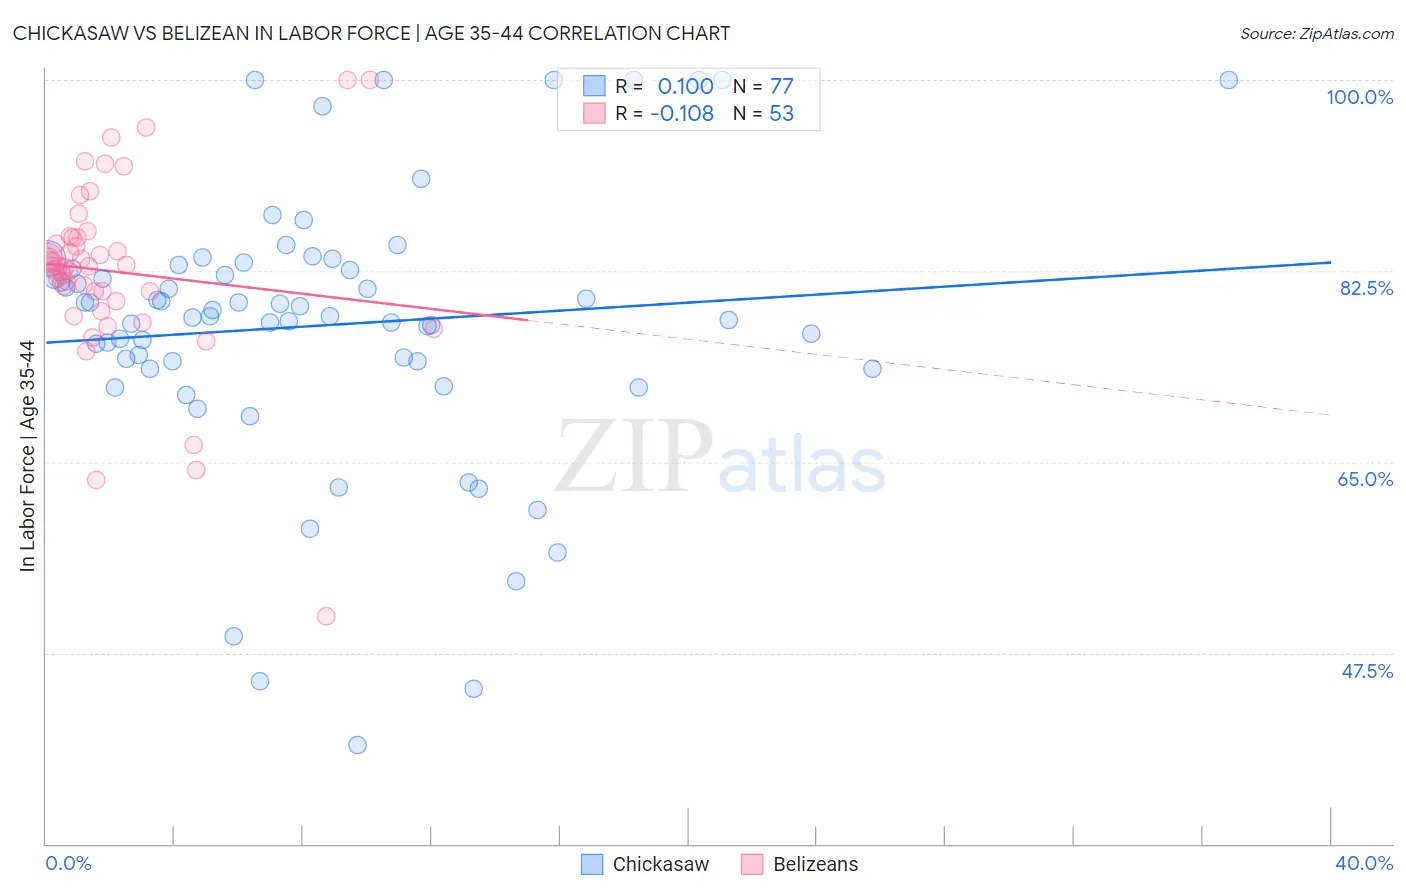
Chickasaw vs Belizean In Labor Force | Age 35-44 Correlation Chart
The statistical analysis conducted on geographies consisting of 147,707,163 people shows a slight positive correlation between the proportion of Chickasaw and labor force participation rate among population between the ages 35 and 44 in the United States with a correlation coefficient (R) of 0.100 and weighted average of 80.9%. Similarly, the statistical analysis conducted on geographies consisting of 144,190,758 people shows a poor negative correlation between the proportion of Belizeans and labor force participation rate among population between the ages 35 and 44 in the United States with a correlation coefficient (R) of -0.108 and weighted average of 83.1%, a difference of 2.8%.
In Labor Force | Age 35-44 Correlation Summary
| Measurement | Chickasaw | Belizean |
| Minimum | 39.0% | 50.8% |
| Maximum | 100.0% | 100.0% |
| Range | 61.0% | 49.2% |
| Mean | 77.5% | 82.5% |
| Median | 78.4% | 83.0% |
| Interquartile 25% (IQ1) | 73.9% | 80.2% |
| Interquartile 75% (IQ3) | 82.9% | 85.5% |
| Interquartile Range (IQR) | 9.0% | 5.4% |
| Standard Deviation (Sample) | 12.5% | 8.4% |
| Standard Deviation (Population) | 12.5% | 8.3% |
Similar Demographics by In Labor Force | Age 35-44
Demographics Similar to Chickasaw by In Labor Force | Age 35-44
In terms of in labor force | age 35-44, the demographic groups most similar to Chickasaw are Inupiat (80.9%, a difference of 0.050%), Puerto Rican (80.7%, a difference of 0.28%), Paiute (80.6%, a difference of 0.35%), Yaqui (80.5%, a difference of 0.46%), and Choctaw (80.5%, a difference of 0.47%).
| Demographics | Rating | Rank | In Labor Force | Age 35-44 |
| Mexicans | 0.0 /100 | #313 | Tragic 81.6% |
| Cajuns | 0.0 /100 | #314 | Tragic 81.5% |
| Immigrants | Mexico | 0.0 /100 | #315 | Tragic 81.5% |
| Comanche | 0.0 /100 | #316 | Tragic 81.5% |
| Cherokee | 0.0 /100 | #317 | Tragic 81.4% |
| Alaskan Athabascans | 0.0 /100 | #318 | Tragic 81.3% |
| Inupiat | 0.0 /100 | #319 | Tragic 80.9% |
| Chickasaw | 0.0 /100 | #320 | Tragic 80.9% |
| Puerto Ricans | 0.0 /100 | #321 | Tragic 80.7% |
| Paiute | 0.0 /100 | #322 | Tragic 80.6% |
| Yaqui | 0.0 /100 | #323 | Tragic 80.5% |
| Choctaw | 0.0 /100 | #324 | Tragic 80.5% |
| Dutch West Indians | 0.0 /100 | #325 | Tragic 80.4% |
| Seminole | 0.0 /100 | #326 | Tragic 80.4% |
| Sioux | 0.0 /100 | #327 | Tragic 80.2% |
Demographics Similar to Belizeans by In Labor Force | Age 35-44
In terms of in labor force | age 35-44, the demographic groups most similar to Belizeans are Immigrants from Micronesia (83.1%, a difference of 0.010%), Dominican (83.1%, a difference of 0.050%), Samoan (83.2%, a difference of 0.070%), Delaware (83.2%, a difference of 0.080%), and Hawaiian (83.2%, a difference of 0.090%).
| Demographics | Rating | Rank | In Labor Force | Age 35-44 |
| French American Indians | 0.0 /100 | #271 | Tragic 83.2% |
| Immigrants | Fiji | 0.0 /100 | #272 | Tragic 83.2% |
| Spanish | 0.0 /100 | #273 | Tragic 83.2% |
| Immigrants | Nonimmigrants | 0.0 /100 | #274 | Tragic 83.2% |
| Hawaiians | 0.0 /100 | #275 | Tragic 83.2% |
| Delaware | 0.0 /100 | #276 | Tragic 83.2% |
| Samoans | 0.0 /100 | #277 | Tragic 83.2% |
| Belizeans | 0.0 /100 | #278 | Tragic 83.1% |
| Immigrants | Micronesia | 0.0 /100 | #279 | Tragic 83.1% |
| Dominicans | 0.0 /100 | #280 | Tragic 83.1% |
| Guatemalans | 0.0 /100 | #281 | Tragic 83.0% |
| Osage | 0.0 /100 | #282 | Tragic 82.9% |
| Immigrants | Guatemala | 0.0 /100 | #283 | Tragic 82.9% |
| Immigrants | Dominican Republic | 0.0 /100 | #284 | Tragic 82.9% |
| Fijians | 0.0 /100 | #285 | Tragic 82.9% |