Osage vs Immigrants from Germany In Labor Force | Age > 16
COMPARE
Osage
Immigrants from Germany
In Labor Force | Age > 16
In Labor Force | Age > 16 Comparison
Osage
Immigrants from Germany
63.5%
IN LABOR FORCE | AGE > 16
0.0/ 100
METRIC RATING
305th/ 347
METRIC RANK
63.9%
IN LABOR FORCE | AGE > 16
0.1/ 100
METRIC RATING
283rd/ 347
METRIC RANK
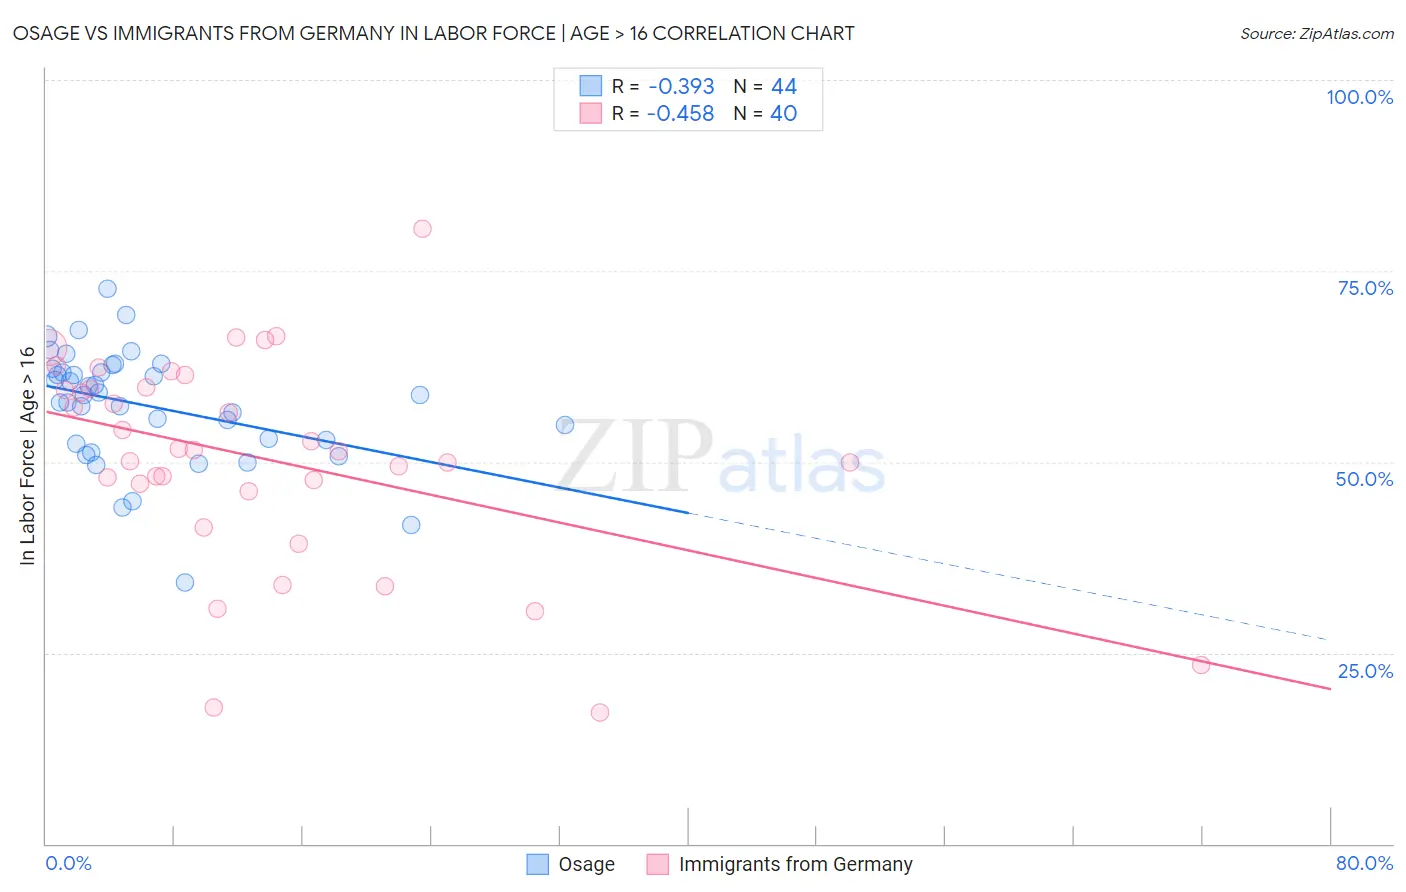
Osage vs Immigrants from Germany In Labor Force | Age > 16 Correlation Chart
The statistical analysis conducted on geographies consisting of 91,805,602 people shows a mild negative correlation between the proportion of Osage and labor force participation rate among population ages 16 and over in the United States with a correlation coefficient (R) of -0.393 and weighted average of 63.5%. Similarly, the statistical analysis conducted on geographies consisting of 463,889,026 people shows a moderate negative correlation between the proportion of Immigrants from Germany and labor force participation rate among population ages 16 and over in the United States with a correlation coefficient (R) of -0.458 and weighted average of 63.9%, a difference of 0.72%.
In Labor Force | Age > 16 Correlation Summary
| Measurement | Osage | Immigrants from Germany |
| Minimum | 34.2% | 17.2% |
| Maximum | 72.7% | 80.6% |
| Range | 38.5% | 63.4% |
| Mean | 57.3% | 50.4% |
| Median | 58.8% | 51.5% |
| Interquartile 25% (IQ1) | 52.6% | 46.7% |
| Interquartile 75% (IQ3) | 62.0% | 59.7% |
| Interquartile Range (IQR) | 9.4% | 13.0% |
| Standard Deviation (Sample) | 7.5% | 13.8% |
| Standard Deviation (Population) | 7.4% | 13.6% |
Similar Demographics by In Labor Force | Age > 16
Demographics Similar to Osage by In Labor Force | Age > 16
In terms of in labor force | age > 16, the demographic groups most similar to Osage are Nonimmigrants (63.5%, a difference of 0.050%), Black/African American (63.4%, a difference of 0.090%), Cree (63.5%, a difference of 0.10%), Central American Indian (63.4%, a difference of 0.13%), and Delaware (63.6%, a difference of 0.14%).
| Demographics | Rating | Rank | In Labor Force | Age > 16 |
| Comanche | 0.0 /100 | #298 | Tragic 63.6% |
| Whites/Caucasians | 0.0 /100 | #299 | Tragic 63.6% |
| Immigrants | Azores | 0.0 /100 | #300 | Tragic 63.6% |
| Spanish Americans | 0.0 /100 | #301 | Tragic 63.6% |
| Delaware | 0.0 /100 | #302 | Tragic 63.6% |
| Cree | 0.0 /100 | #303 | Tragic 63.5% |
| Immigrants | Nonimmigrants | 0.0 /100 | #304 | Tragic 63.5% |
| Osage | 0.0 /100 | #305 | Tragic 63.5% |
| Blacks/African Americans | 0.0 /100 | #306 | Tragic 63.4% |
| Central American Indians | 0.0 /100 | #307 | Tragic 63.4% |
| Pennsylvania Germans | 0.0 /100 | #308 | Tragic 63.4% |
| Scotch-Irish | 0.0 /100 | #309 | Tragic 63.3% |
| Shoshone | 0.0 /100 | #310 | Tragic 63.2% |
| Blackfeet | 0.0 /100 | #311 | Tragic 63.2% |
| Iroquois | 0.0 /100 | #312 | Tragic 63.2% |
Demographics Similar to Immigrants from Germany by In Labor Force | Age > 16
In terms of in labor force | age > 16, the demographic groups most similar to Immigrants from Germany are French (63.9%, a difference of 0.010%), Immigrants from Guyana (64.0%, a difference of 0.040%), Slovak (63.9%, a difference of 0.040%), Immigrants from Austria (63.9%, a difference of 0.070%), and Scottish (63.9%, a difference of 0.070%).
| Demographics | Rating | Rank | In Labor Force | Age > 16 |
| French American Indians | 0.3 /100 | #276 | Tragic 64.1% |
| Immigrants | Bahamas | 0.3 /100 | #277 | Tragic 64.0% |
| Assyrians/Chaldeans/Syriacs | 0.3 /100 | #278 | Tragic 64.0% |
| Welsh | 0.2 /100 | #279 | Tragic 64.0% |
| Immigrants | St. Vincent and the Grenadines | 0.2 /100 | #280 | Tragic 64.0% |
| French Canadians | 0.2 /100 | #281 | Tragic 64.0% |
| Immigrants | Guyana | 0.2 /100 | #282 | Tragic 64.0% |
| Immigrants | Germany | 0.1 /100 | #283 | Tragic 63.9% |
| French | 0.1 /100 | #284 | Tragic 63.9% |
| Slovaks | 0.1 /100 | #285 | Tragic 63.9% |
| Immigrants | Austria | 0.1 /100 | #286 | Tragic 63.9% |
| Scottish | 0.1 /100 | #287 | Tragic 63.9% |
| Spanish | 0.1 /100 | #288 | Tragic 63.9% |
| Celtics | 0.1 /100 | #289 | Tragic 63.8% |
| Hungarians | 0.1 /100 | #290 | Tragic 63.8% |