Choctaw vs Immigrants from Germany In Labor Force | Age > 16
COMPARE
Choctaw
Immigrants from Germany
In Labor Force | Age > 16
In Labor Force | Age > 16 Comparison
Choctaw
Immigrants from Germany
61.5%
IN LABOR FORCE | AGE > 16
0.0/ 100
METRIC RATING
329th/ 347
METRIC RANK
63.9%
IN LABOR FORCE | AGE > 16
0.1/ 100
METRIC RATING
283rd/ 347
METRIC RANK
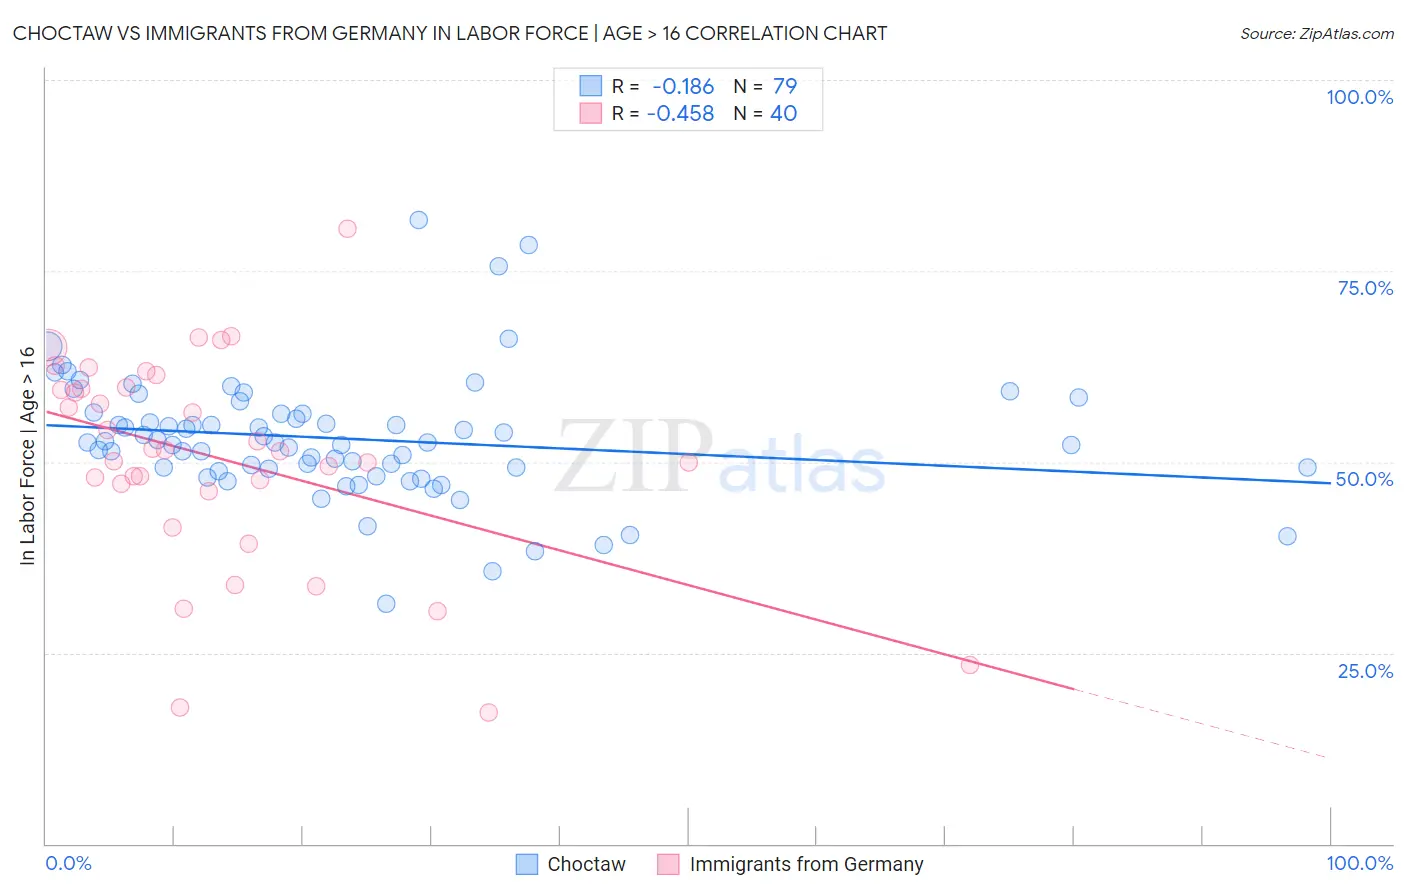
Choctaw vs Immigrants from Germany In Labor Force | Age > 16 Correlation Chart
The statistical analysis conducted on geographies consisting of 269,719,523 people shows a poor negative correlation between the proportion of Choctaw and labor force participation rate among population ages 16 and over in the United States with a correlation coefficient (R) of -0.186 and weighted average of 61.5%. Similarly, the statistical analysis conducted on geographies consisting of 463,889,026 people shows a moderate negative correlation between the proportion of Immigrants from Germany and labor force participation rate among population ages 16 and over in the United States with a correlation coefficient (R) of -0.458 and weighted average of 63.9%, a difference of 4.0%.
In Labor Force | Age > 16 Correlation Summary
| Measurement | Choctaw | Immigrants from Germany |
| Minimum | 31.5% | 17.2% |
| Maximum | 81.6% | 80.6% |
| Range | 50.1% | 63.4% |
| Mean | 53.1% | 50.4% |
| Median | 52.5% | 51.5% |
| Interquartile 25% (IQ1) | 49.1% | 46.7% |
| Interquartile 75% (IQ3) | 56.4% | 59.7% |
| Interquartile Range (IQR) | 7.2% | 13.0% |
| Standard Deviation (Sample) | 8.2% | 13.8% |
| Standard Deviation (Population) | 8.1% | 13.6% |
Similar Demographics by In Labor Force | Age > 16
Demographics Similar to Choctaw by In Labor Force | Age > 16
In terms of in labor force | age > 16, the demographic groups most similar to Choctaw are Creek (61.3%, a difference of 0.22%), Dutch West Indian (61.7%, a difference of 0.36%), Cajun (61.8%, a difference of 0.52%), Sioux (61.8%, a difference of 0.63%), and Cherokee (61.9%, a difference of 0.81%).
| Demographics | Rating | Rank | In Labor Force | Age > 16 |
| Ottawa | 0.0 /100 | #322 | Tragic 62.0% |
| Seminole | 0.0 /100 | #323 | Tragic 62.0% |
| Cheyenne | 0.0 /100 | #324 | Tragic 62.0% |
| Cherokee | 0.0 /100 | #325 | Tragic 61.9% |
| Sioux | 0.0 /100 | #326 | Tragic 61.8% |
| Cajuns | 0.0 /100 | #327 | Tragic 61.8% |
| Dutch West Indians | 0.0 /100 | #328 | Tragic 61.7% |
| Choctaw | 0.0 /100 | #329 | Tragic 61.5% |
| Creek | 0.0 /100 | #330 | Tragic 61.3% |
| Ute | 0.0 /100 | #331 | Tragic 60.9% |
| Crow | 0.0 /100 | #332 | Tragic 60.8% |
| Paiute | 0.0 /100 | #333 | Tragic 60.7% |
| Apache | 0.0 /100 | #334 | Tragic 60.7% |
| Natives/Alaskans | 0.0 /100 | #335 | Tragic 60.6% |
| Menominee | 0.0 /100 | #336 | Tragic 60.6% |
Demographics Similar to Immigrants from Germany by In Labor Force | Age > 16
In terms of in labor force | age > 16, the demographic groups most similar to Immigrants from Germany are French (63.9%, a difference of 0.010%), Immigrants from Guyana (64.0%, a difference of 0.040%), Slovak (63.9%, a difference of 0.040%), Immigrants from Austria (63.9%, a difference of 0.070%), and Scottish (63.9%, a difference of 0.070%).
| Demographics | Rating | Rank | In Labor Force | Age > 16 |
| French American Indians | 0.3 /100 | #276 | Tragic 64.1% |
| Immigrants | Bahamas | 0.3 /100 | #277 | Tragic 64.0% |
| Assyrians/Chaldeans/Syriacs | 0.3 /100 | #278 | Tragic 64.0% |
| Welsh | 0.2 /100 | #279 | Tragic 64.0% |
| Immigrants | St. Vincent and the Grenadines | 0.2 /100 | #280 | Tragic 64.0% |
| French Canadians | 0.2 /100 | #281 | Tragic 64.0% |
| Immigrants | Guyana | 0.2 /100 | #282 | Tragic 64.0% |
| Immigrants | Germany | 0.1 /100 | #283 | Tragic 63.9% |
| French | 0.1 /100 | #284 | Tragic 63.9% |
| Slovaks | 0.1 /100 | #285 | Tragic 63.9% |
| Immigrants | Austria | 0.1 /100 | #286 | Tragic 63.9% |
| Scottish | 0.1 /100 | #287 | Tragic 63.9% |
| Spanish | 0.1 /100 | #288 | Tragic 63.9% |
| Celtics | 0.1 /100 | #289 | Tragic 63.8% |
| Hungarians | 0.1 /100 | #290 | Tragic 63.8% |