Osage vs Immigrants from Germany Divorced or Separated
COMPARE
Osage
Immigrants from Germany
Divorced or Separated
Divorced or Separated Comparison
Osage
Immigrants from Germany
13.4%
DIVORCED OR SEPARATED
0.0/ 100
METRIC RATING
324th/ 347
METRIC RANK
12.4%
DIVORCED OR SEPARATED
4.0/ 100
METRIC RATING
239th/ 347
METRIC RANK
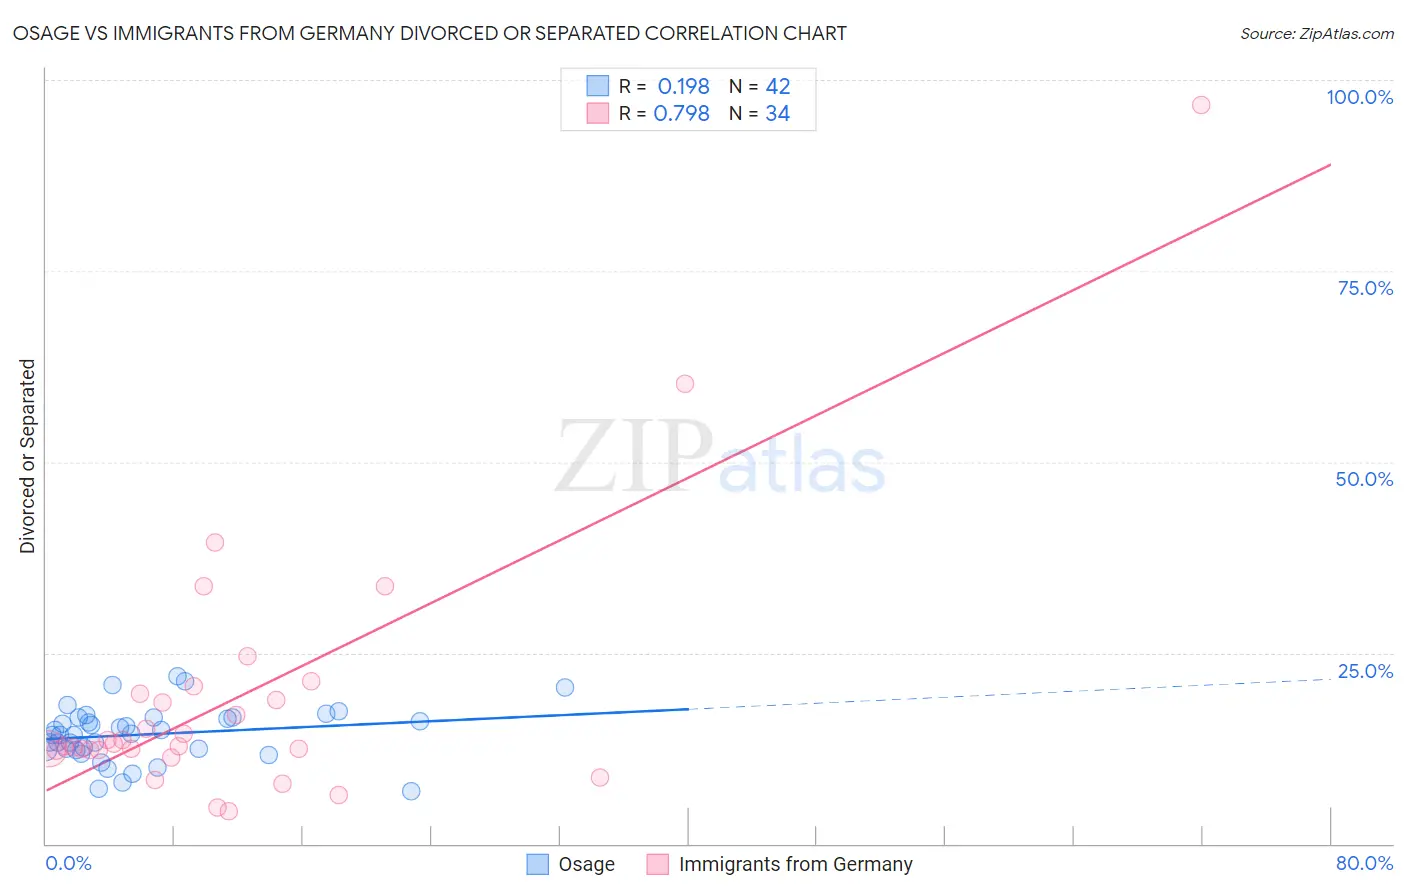
Osage vs Immigrants from Germany Divorced or Separated Correlation Chart
The statistical analysis conducted on geographies consisting of 91,805,923 people shows a poor positive correlation between the proportion of Osage and percentage of population currently divorced or separated in the United States with a correlation coefficient (R) of 0.198 and weighted average of 13.4%. Similarly, the statistical analysis conducted on geographies consisting of 463,791,501 people shows a strong positive correlation between the proportion of Immigrants from Germany and percentage of population currently divorced or separated in the United States with a correlation coefficient (R) of 0.798 and weighted average of 12.4%, a difference of 8.6%.
Divorced or Separated Correlation Summary
| Measurement | Osage | Immigrants from Germany |
| Minimum | 6.9% | 4.2% |
| Maximum | 22.0% | 96.8% |
| Range | 15.1% | 92.6% |
| Mean | 14.3% | 19.1% |
| Median | 14.3% | 13.0% |
| Interquartile 25% (IQ1) | 12.3% | 12.3% |
| Interquartile 75% (IQ3) | 16.5% | 19.6% |
| Interquartile Range (IQR) | 4.1% | 7.3% |
| Standard Deviation (Sample) | 3.5% | 17.6% |
| Standard Deviation (Population) | 3.5% | 17.3% |
Similar Demographics by Divorced or Separated
Demographics Similar to Osage by Divorced or Separated
In terms of divorced or separated, the demographic groups most similar to Osage are Potawatomi (13.5%, a difference of 0.060%), U.S. Virgin Islander (13.4%, a difference of 0.070%), Immigrants from Congo (13.5%, a difference of 0.070%), Immigrants from Haiti (13.4%, a difference of 0.29%), and Cheyenne (13.4%, a difference of 0.53%).
| Demographics | Rating | Rank | Divorced or Separated |
| Haitians | 0.0 /100 | #317 | Tragic 13.3% |
| Cree | 0.0 /100 | #318 | Tragic 13.4% |
| Puget Sound Salish | 0.0 /100 | #319 | Tragic 13.4% |
| Cajuns | 0.0 /100 | #320 | Tragic 13.4% |
| Cheyenne | 0.0 /100 | #321 | Tragic 13.4% |
| Immigrants | Haiti | 0.0 /100 | #322 | Tragic 13.4% |
| U.S. Virgin Islanders | 0.0 /100 | #323 | Tragic 13.4% |
| Osage | 0.0 /100 | #324 | Tragic 13.4% |
| Potawatomi | 0.0 /100 | #325 | Tragic 13.5% |
| Immigrants | Congo | 0.0 /100 | #326 | Tragic 13.5% |
| Comanche | 0.0 /100 | #327 | Tragic 13.5% |
| Immigrants | Caribbean | 0.0 /100 | #328 | Tragic 13.6% |
| Houma | 0.0 /100 | #329 | Tragic 13.6% |
| Paiute | 0.0 /100 | #330 | Tragic 13.6% |
| Blacks/African Americans | 0.0 /100 | #331 | Tragic 13.6% |
Demographics Similar to Immigrants from Germany by Divorced or Separated
In terms of divorced or separated, the demographic groups most similar to Immigrants from Germany are Sudanese (12.4%, a difference of 0.010%), Colombian (12.4%, a difference of 0.040%), Immigrants from Laos (12.4%, a difference of 0.040%), British West Indian (12.4%, a difference of 0.050%), and Immigrants from Bosnia and Herzegovina (12.4%, a difference of 0.070%).
| Demographics | Rating | Rank | Divorced or Separated |
| Canadians | 5.3 /100 | #232 | Tragic 12.4% |
| Malaysians | 4.8 /100 | #233 | Tragic 12.4% |
| West Indians | 4.4 /100 | #234 | Tragic 12.4% |
| Immigrants | Bosnia and Herzegovina | 4.3 /100 | #235 | Tragic 12.4% |
| Colombians | 4.2 /100 | #236 | Tragic 12.4% |
| Immigrants | Laos | 4.2 /100 | #237 | Tragic 12.4% |
| Sudanese | 4.0 /100 | #238 | Tragic 12.4% |
| Immigrants | Germany | 4.0 /100 | #239 | Tragic 12.4% |
| British West Indians | 3.7 /100 | #240 | Tragic 12.4% |
| Uruguayans | 3.4 /100 | #241 | Tragic 12.4% |
| Dutch | 3.1 /100 | #242 | Tragic 12.4% |
| Immigrants | Latin America | 2.8 /100 | #243 | Tragic 12.4% |
| Alaska Natives | 2.5 /100 | #244 | Tragic 12.4% |
| Hispanics or Latinos | 2.0 /100 | #245 | Tragic 12.5% |
| Immigrants | West Indies | 1.9 /100 | #246 | Tragic 12.5% |