Bermudan vs Immigrants from Germany In Labor Force | Age > 16
COMPARE
Bermudan
Immigrants from Germany
In Labor Force | Age > 16
In Labor Force | Age > 16 Comparison
Bermudans
Immigrants from Germany
66.0%
IN LABOR FORCE | AGE > 16
99.3/ 100
METRIC RATING
88th/ 347
METRIC RANK
63.9%
IN LABOR FORCE | AGE > 16
0.1/ 100
METRIC RATING
283rd/ 347
METRIC RANK
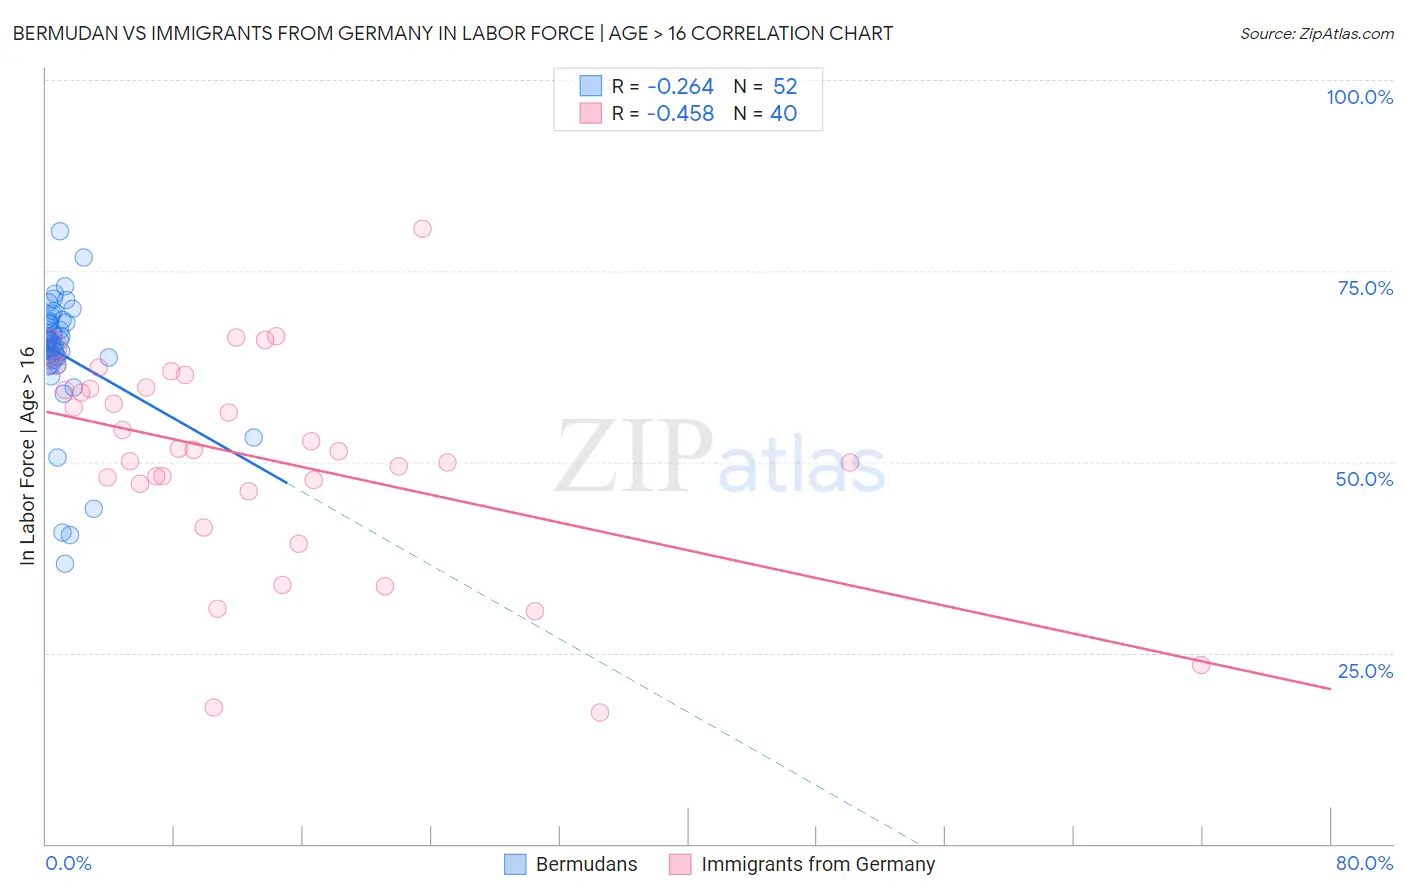
Bermudan vs Immigrants from Germany In Labor Force | Age > 16 Correlation Chart
The statistical analysis conducted on geographies consisting of 55,730,379 people shows a weak negative correlation between the proportion of Bermudans and labor force participation rate among population ages 16 and over in the United States with a correlation coefficient (R) of -0.264 and weighted average of 66.0%. Similarly, the statistical analysis conducted on geographies consisting of 463,889,026 people shows a moderate negative correlation between the proportion of Immigrants from Germany and labor force participation rate among population ages 16 and over in the United States with a correlation coefficient (R) of -0.458 and weighted average of 63.9%, a difference of 3.3%.
In Labor Force | Age > 16 Correlation Summary
| Measurement | Bermudan | Immigrants from Germany |
| Minimum | 36.6% | 17.2% |
| Maximum | 80.2% | 80.6% |
| Range | 43.6% | 63.4% |
| Mean | 64.1% | 50.4% |
| Median | 65.6% | 51.5% |
| Interquartile 25% (IQ1) | 63.4% | 46.7% |
| Interquartile 75% (IQ3) | 68.3% | 59.7% |
| Interquartile Range (IQR) | 4.9% | 13.0% |
| Standard Deviation (Sample) | 8.4% | 13.8% |
| Standard Deviation (Population) | 8.3% | 13.6% |
Similar Demographics by In Labor Force | Age > 16
Demographics Similar to Bermudans by In Labor Force | Age > 16
In terms of in labor force | age > 16, the demographic groups most similar to Bermudans are South American Indian (66.0%, a difference of 0.0%), South American (66.0%, a difference of 0.010%), Mongolian (66.1%, a difference of 0.030%), Immigrants from Jordan (66.1%, a difference of 0.040%), and Central American (66.1%, a difference of 0.040%).
| Demographics | Rating | Rank | In Labor Force | Age > 16 |
| Moroccans | 99.5 /100 | #81 | Exceptional 66.1% |
| German Russians | 99.4 /100 | #82 | Exceptional 66.1% |
| Immigrants | Jordan | 99.4 /100 | #83 | Exceptional 66.1% |
| Central Americans | 99.4 /100 | #84 | Exceptional 66.1% |
| Mongolians | 99.4 /100 | #85 | Exceptional 66.1% |
| South Americans | 99.4 /100 | #86 | Exceptional 66.0% |
| South American Indians | 99.4 /100 | #87 | Exceptional 66.0% |
| Bermudans | 99.3 /100 | #88 | Exceptional 66.0% |
| Immigrants | Laos | 99.2 /100 | #89 | Exceptional 66.0% |
| Chileans | 99.2 /100 | #90 | Exceptional 66.0% |
| Iranians | 99.2 /100 | #91 | Exceptional 66.0% |
| Aleuts | 99.1 /100 | #92 | Exceptional 66.0% |
| Immigrants | South America | 99.1 /100 | #93 | Exceptional 66.0% |
| Immigrants | Cambodia | 99.1 /100 | #94 | Exceptional 66.0% |
| Immigrants | Uruguay | 99.1 /100 | #95 | Exceptional 66.0% |
Demographics Similar to Immigrants from Germany by In Labor Force | Age > 16
In terms of in labor force | age > 16, the demographic groups most similar to Immigrants from Germany are French (63.9%, a difference of 0.010%), Immigrants from Guyana (64.0%, a difference of 0.040%), Slovak (63.9%, a difference of 0.040%), Immigrants from Austria (63.9%, a difference of 0.070%), and Scottish (63.9%, a difference of 0.070%).
| Demographics | Rating | Rank | In Labor Force | Age > 16 |
| French American Indians | 0.3 /100 | #276 | Tragic 64.1% |
| Immigrants | Bahamas | 0.3 /100 | #277 | Tragic 64.0% |
| Assyrians/Chaldeans/Syriacs | 0.3 /100 | #278 | Tragic 64.0% |
| Welsh | 0.2 /100 | #279 | Tragic 64.0% |
| Immigrants | St. Vincent and the Grenadines | 0.2 /100 | #280 | Tragic 64.0% |
| French Canadians | 0.2 /100 | #281 | Tragic 64.0% |
| Immigrants | Guyana | 0.2 /100 | #282 | Tragic 64.0% |
| Immigrants | Germany | 0.1 /100 | #283 | Tragic 63.9% |
| French | 0.1 /100 | #284 | Tragic 63.9% |
| Slovaks | 0.1 /100 | #285 | Tragic 63.9% |
| Immigrants | Austria | 0.1 /100 | #286 | Tragic 63.9% |
| Scottish | 0.1 /100 | #287 | Tragic 63.9% |
| Spanish | 0.1 /100 | #288 | Tragic 63.9% |
| Celtics | 0.1 /100 | #289 | Tragic 63.8% |
| Hungarians | 0.1 /100 | #290 | Tragic 63.8% |