Immigrants from Ukraine vs Immigrants from Germany In Labor Force | Age > 16
COMPARE
Immigrants from Ukraine
Immigrants from Germany
In Labor Force | Age > 16
In Labor Force | Age > 16 Comparison
Immigrants from Ukraine
Immigrants from Germany
65.1%
IN LABOR FORCE | AGE > 16
53.7/ 100
METRIC RATING
173rd/ 347
METRIC RANK
63.9%
IN LABOR FORCE | AGE > 16
0.1/ 100
METRIC RATING
283rd/ 347
METRIC RANK
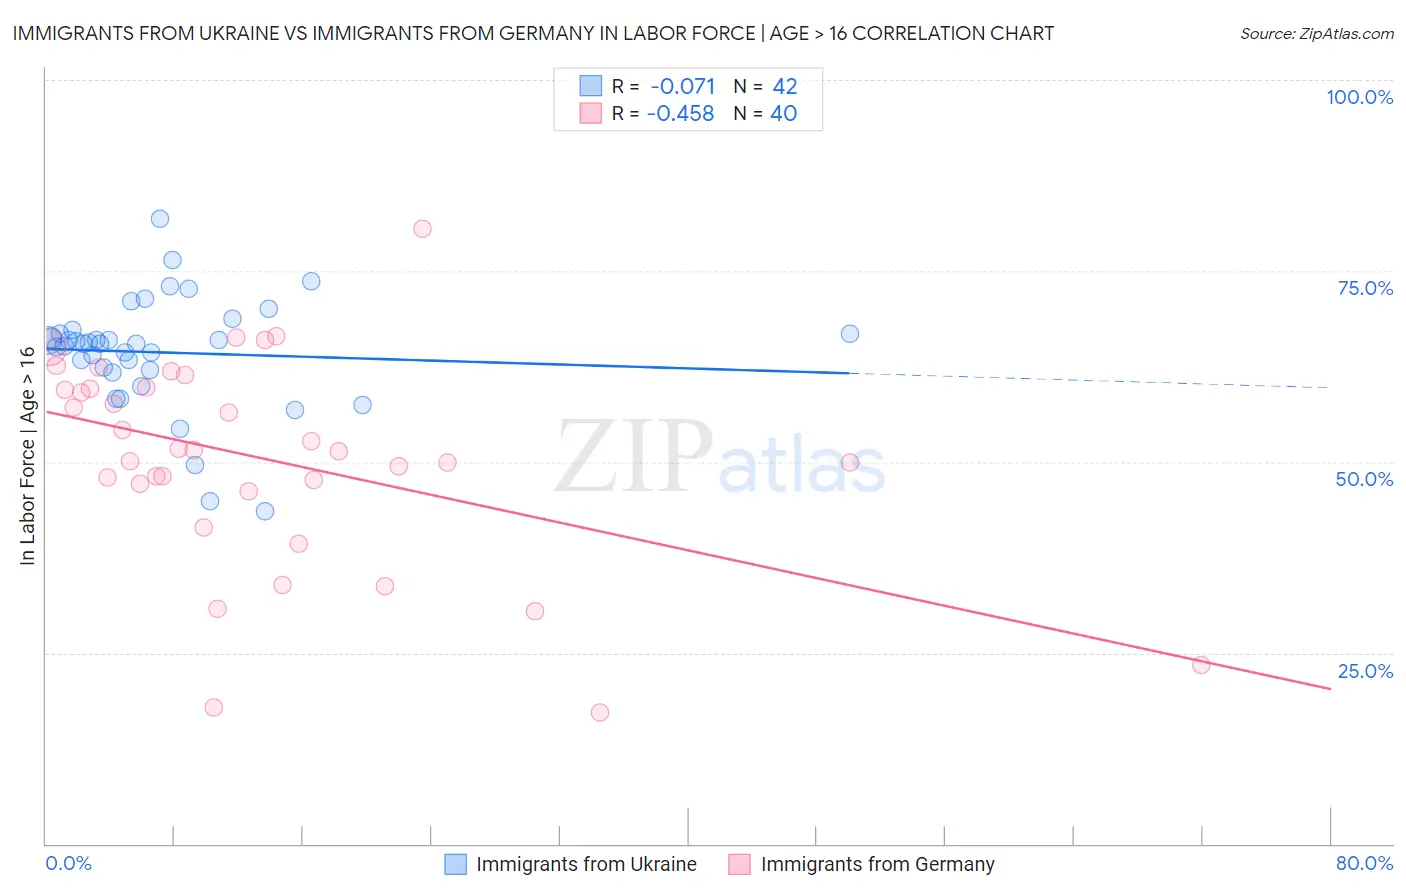
Immigrants from Ukraine vs Immigrants from Germany In Labor Force | Age > 16 Correlation Chart
The statistical analysis conducted on geographies consisting of 289,705,583 people shows a slight negative correlation between the proportion of Immigrants from Ukraine and labor force participation rate among population ages 16 and over in the United States with a correlation coefficient (R) of -0.071 and weighted average of 65.1%. Similarly, the statistical analysis conducted on geographies consisting of 463,889,026 people shows a moderate negative correlation between the proportion of Immigrants from Germany and labor force participation rate among population ages 16 and over in the United States with a correlation coefficient (R) of -0.458 and weighted average of 63.9%, a difference of 1.9%.
In Labor Force | Age > 16 Correlation Summary
| Measurement | Immigrants from Ukraine | Immigrants from Germany |
| Minimum | 43.5% | 17.2% |
| Maximum | 81.8% | 80.6% |
| Range | 38.3% | 63.4% |
| Mean | 64.3% | 50.4% |
| Median | 65.5% | 51.5% |
| Interquartile 25% (IQ1) | 62.1% | 46.7% |
| Interquartile 75% (IQ3) | 66.8% | 59.7% |
| Interquartile Range (IQR) | 4.7% | 13.0% |
| Standard Deviation (Sample) | 7.4% | 13.8% |
| Standard Deviation (Population) | 7.3% | 13.6% |
Similar Demographics by In Labor Force | Age > 16
Demographics Similar to Immigrants from Ukraine by In Labor Force | Age > 16
In terms of in labor force | age > 16, the demographic groups most similar to Immigrants from Ukraine are Macedonian (65.1%, a difference of 0.040%), Nicaraguan (65.1%, a difference of 0.040%), Swedish (65.1%, a difference of 0.070%), Eastern European (65.1%, a difference of 0.080%), and Immigrants from Israel (65.2%, a difference of 0.090%).
| Demographics | Rating | Rank | In Labor Force | Age > 16 |
| Immigrants | Western Asia | 67.3 /100 | #166 | Good 65.3% |
| Immigrants | Belarus | 66.0 /100 | #167 | Good 65.2% |
| Serbians | 63.5 /100 | #168 | Good 65.2% |
| Arabs | 62.4 /100 | #169 | Good 65.2% |
| Immigrants | Israel | 61.7 /100 | #170 | Good 65.2% |
| Israelis | 61.6 /100 | #171 | Good 65.2% |
| Immigrants | Sweden | 61.3 /100 | #172 | Good 65.2% |
| Immigrants | Ukraine | 53.7 /100 | #173 | Average 65.1% |
| Macedonians | 50.0 /100 | #174 | Average 65.1% |
| Nicaraguans | 49.7 /100 | #175 | Average 65.1% |
| Swedes | 47.4 /100 | #176 | Average 65.1% |
| Eastern Europeans | 46.2 /100 | #177 | Average 65.1% |
| Trinidadians and Tobagonians | 45.2 /100 | #178 | Average 65.1% |
| Immigrants | Haiti | 43.3 /100 | #179 | Average 65.1% |
| Immigrants | Latvia | 42.9 /100 | #180 | Average 65.1% |
Demographics Similar to Immigrants from Germany by In Labor Force | Age > 16
In terms of in labor force | age > 16, the demographic groups most similar to Immigrants from Germany are French (63.9%, a difference of 0.010%), Immigrants from Guyana (64.0%, a difference of 0.040%), Slovak (63.9%, a difference of 0.040%), Immigrants from Austria (63.9%, a difference of 0.070%), and Scottish (63.9%, a difference of 0.070%).
| Demographics | Rating | Rank | In Labor Force | Age > 16 |
| French American Indians | 0.3 /100 | #276 | Tragic 64.1% |
| Immigrants | Bahamas | 0.3 /100 | #277 | Tragic 64.0% |
| Assyrians/Chaldeans/Syriacs | 0.3 /100 | #278 | Tragic 64.0% |
| Welsh | 0.2 /100 | #279 | Tragic 64.0% |
| Immigrants | St. Vincent and the Grenadines | 0.2 /100 | #280 | Tragic 64.0% |
| French Canadians | 0.2 /100 | #281 | Tragic 64.0% |
| Immigrants | Guyana | 0.2 /100 | #282 | Tragic 64.0% |
| Immigrants | Germany | 0.1 /100 | #283 | Tragic 63.9% |
| French | 0.1 /100 | #284 | Tragic 63.9% |
| Slovaks | 0.1 /100 | #285 | Tragic 63.9% |
| Immigrants | Austria | 0.1 /100 | #286 | Tragic 63.9% |
| Scottish | 0.1 /100 | #287 | Tragic 63.9% |
| Spanish | 0.1 /100 | #288 | Tragic 63.9% |
| Celtics | 0.1 /100 | #289 | Tragic 63.8% |
| Hungarians | 0.1 /100 | #290 | Tragic 63.8% |