Osage vs Spaniard In Labor Force | Age > 16
COMPARE
Osage
Spaniard
In Labor Force | Age > 16
In Labor Force | Age > 16 Comparison
Osage
Spaniards
63.5%
IN LABOR FORCE | AGE > 16
0.0/ 100
METRIC RATING
305th/ 347
METRIC RANK
64.1%
IN LABOR FORCE | AGE > 16
0.5/ 100
METRIC RATING
268th/ 347
METRIC RANK
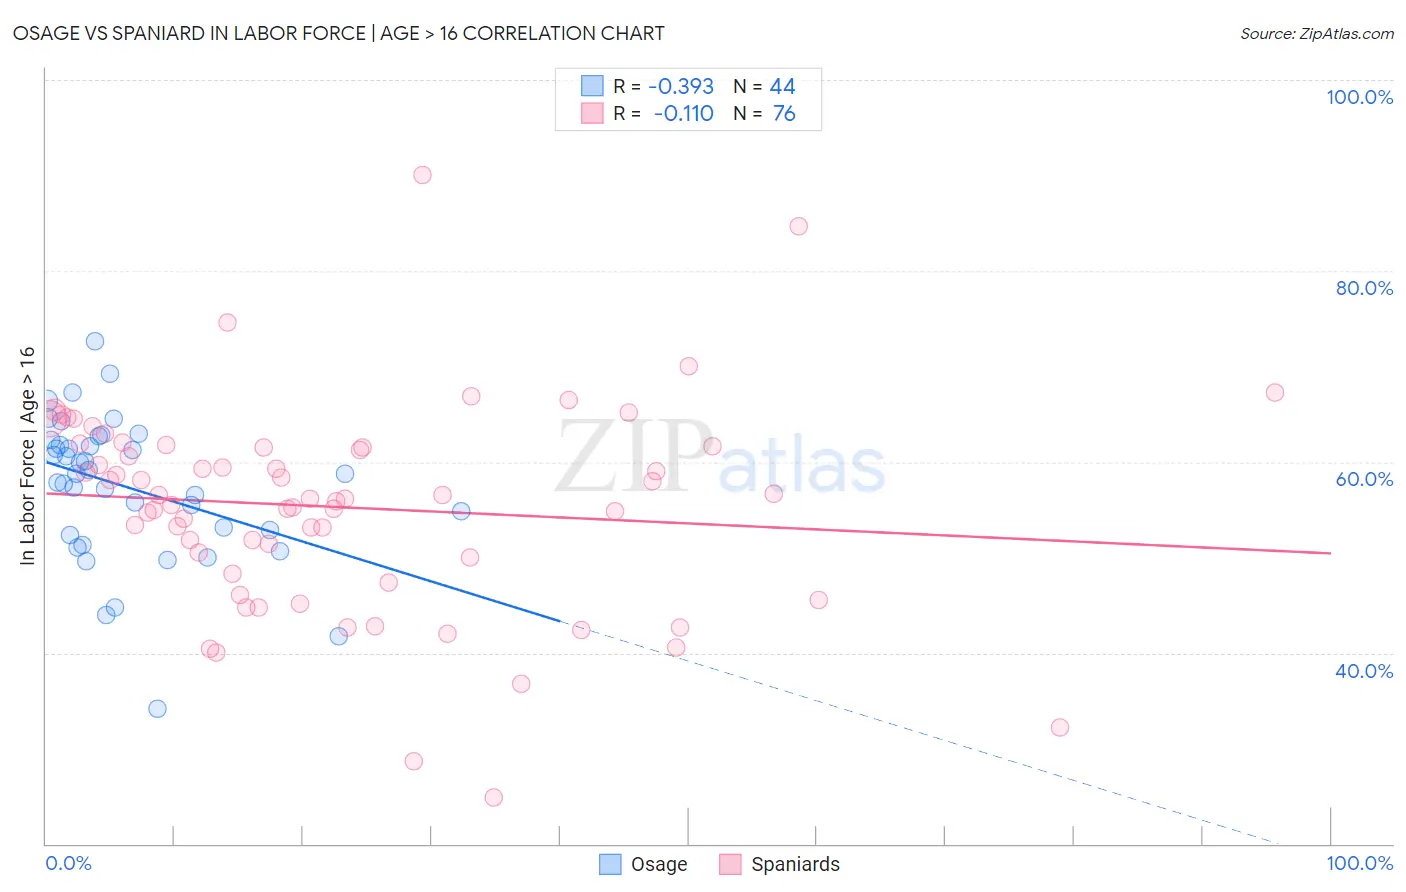
Osage vs Spaniard In Labor Force | Age > 16 Correlation Chart
The statistical analysis conducted on geographies consisting of 91,805,602 people shows a mild negative correlation between the proportion of Osage and labor force participation rate among population ages 16 and over in the United States with a correlation coefficient (R) of -0.393 and weighted average of 63.5%. Similarly, the statistical analysis conducted on geographies consisting of 443,548,317 people shows a poor negative correlation between the proportion of Spaniards and labor force participation rate among population ages 16 and over in the United States with a correlation coefficient (R) of -0.110 and weighted average of 64.1%, a difference of 1.1%.
In Labor Force | Age > 16 Correlation Summary
| Measurement | Osage | Spaniard |
| Minimum | 34.2% | 24.9% |
| Maximum | 72.7% | 90.0% |
| Range | 38.5% | 65.1% |
| Mean | 57.3% | 55.2% |
| Median | 58.8% | 56.2% |
| Interquartile 25% (IQ1) | 52.6% | 49.1% |
| Interquartile 75% (IQ3) | 62.0% | 61.6% |
| Interquartile Range (IQR) | 9.4% | 12.5% |
| Standard Deviation (Sample) | 7.5% | 10.9% |
| Standard Deviation (Population) | 7.4% | 10.8% |
Similar Demographics by In Labor Force | Age > 16
Demographics Similar to Osage by In Labor Force | Age > 16
In terms of in labor force | age > 16, the demographic groups most similar to Osage are Nonimmigrants (63.5%, a difference of 0.050%), Black/African American (63.4%, a difference of 0.090%), Cree (63.5%, a difference of 0.10%), Central American Indian (63.4%, a difference of 0.13%), and Delaware (63.6%, a difference of 0.14%).
| Demographics | Rating | Rank | In Labor Force | Age > 16 |
| Comanche | 0.0 /100 | #298 | Tragic 63.6% |
| Whites/Caucasians | 0.0 /100 | #299 | Tragic 63.6% |
| Immigrants | Azores | 0.0 /100 | #300 | Tragic 63.6% |
| Spanish Americans | 0.0 /100 | #301 | Tragic 63.6% |
| Delaware | 0.0 /100 | #302 | Tragic 63.6% |
| Cree | 0.0 /100 | #303 | Tragic 63.5% |
| Immigrants | Nonimmigrants | 0.0 /100 | #304 | Tragic 63.5% |
| Osage | 0.0 /100 | #305 | Tragic 63.5% |
| Blacks/African Americans | 0.0 /100 | #306 | Tragic 63.4% |
| Central American Indians | 0.0 /100 | #307 | Tragic 63.4% |
| Pennsylvania Germans | 0.0 /100 | #308 | Tragic 63.4% |
| Scotch-Irish | 0.0 /100 | #309 | Tragic 63.3% |
| Shoshone | 0.0 /100 | #310 | Tragic 63.2% |
| Blackfeet | 0.0 /100 | #311 | Tragic 63.2% |
| Iroquois | 0.0 /100 | #312 | Tragic 63.2% |
Demographics Similar to Spaniards by In Labor Force | Age > 16
In terms of in labor force | age > 16, the demographic groups most similar to Spaniards are Canadian (64.1%, a difference of 0.0%), Immigrants from England (64.2%, a difference of 0.010%), Cuban (64.2%, a difference of 0.020%), Irish (64.1%, a difference of 0.040%), and Dutch (64.2%, a difference of 0.060%).
| Demographics | Rating | Rank | In Labor Force | Age > 16 |
| Basques | 0.7 /100 | #261 | Tragic 64.2% |
| Finns | 0.7 /100 | #262 | Tragic 64.2% |
| Bahamians | 0.6 /100 | #263 | Tragic 64.2% |
| Dutch | 0.6 /100 | #264 | Tragic 64.2% |
| Cubans | 0.5 /100 | #265 | Tragic 64.2% |
| Immigrants | England | 0.5 /100 | #266 | Tragic 64.2% |
| Canadians | 0.5 /100 | #267 | Tragic 64.1% |
| Spaniards | 0.5 /100 | #268 | Tragic 64.1% |
| Irish | 0.4 /100 | #269 | Tragic 64.1% |
| Guyanese | 0.4 /100 | #270 | Tragic 64.1% |
| Dominicans | 0.4 /100 | #271 | Tragic 64.1% |
| Native Hawaiians | 0.3 /100 | #272 | Tragic 64.1% |
| Hmong | 0.3 /100 | #273 | Tragic 64.1% |
| Immigrants | Cuba | 0.3 /100 | #274 | Tragic 64.1% |
| Mexicans | 0.3 /100 | #275 | Tragic 64.1% |