Okinawan vs Immigrants from Israel In Labor Force | Age 16-19
COMPARE
Okinawan
Immigrants from Israel
In Labor Force | Age 16-19
In Labor Force | Age 16-19 Comparison
Okinawans
Immigrants from Israel
32.8%
IN LABOR FORCE | AGE 16-19
0.0/ 100
METRIC RATING
301st/ 347
METRIC RANK
30.5%
IN LABOR FORCE | AGE 16-19
0.0/ 100
METRIC RATING
332nd/ 347
METRIC RANK
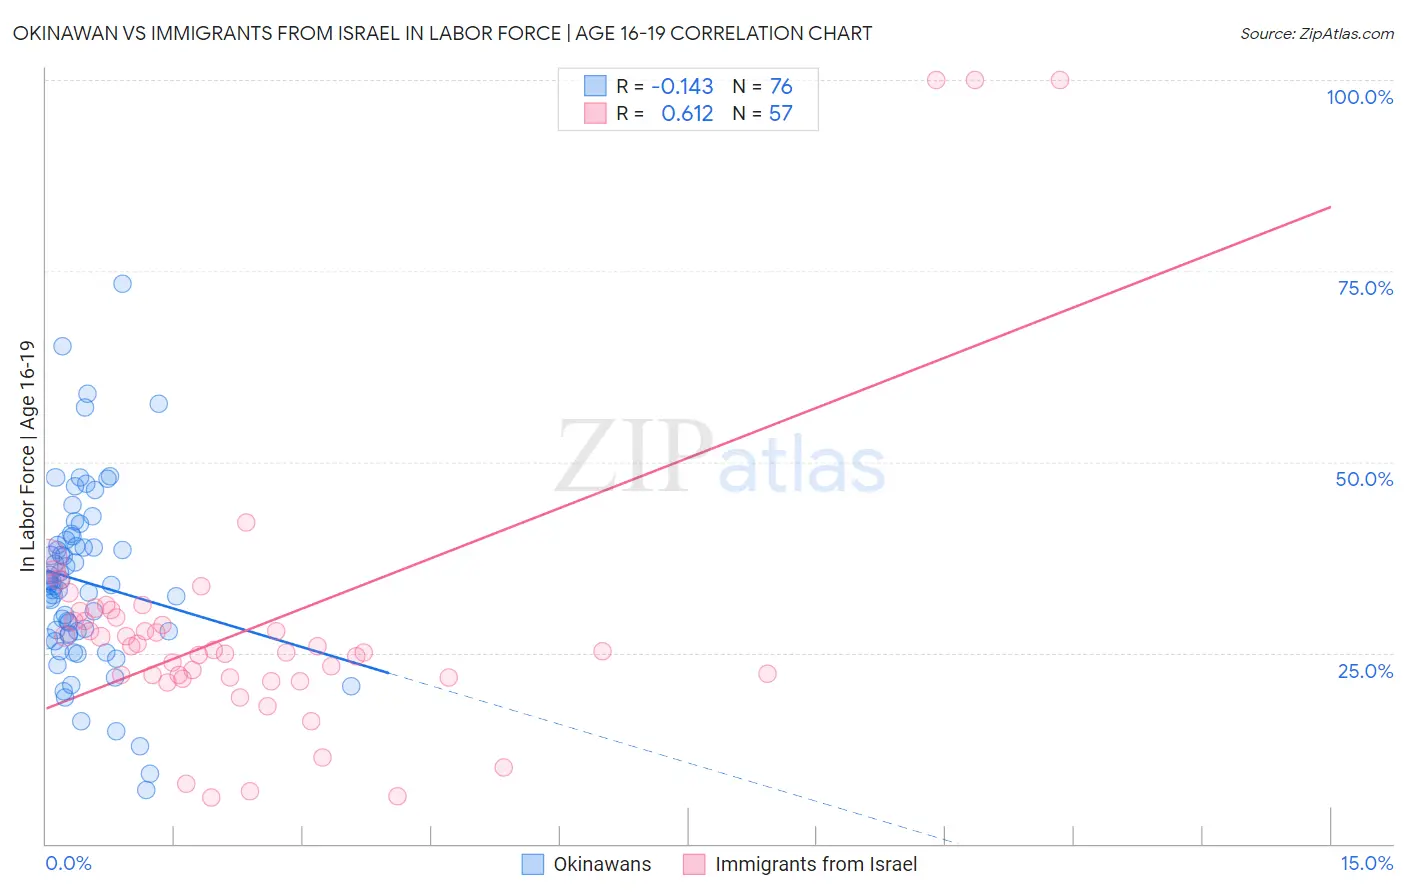
Okinawan vs Immigrants from Israel In Labor Force | Age 16-19 Correlation Chart
The statistical analysis conducted on geographies consisting of 73,748,077 people shows a poor negative correlation between the proportion of Okinawans and labor force participation rate among population between the ages 16 and 19 in the United States with a correlation coefficient (R) of -0.143 and weighted average of 32.8%. Similarly, the statistical analysis conducted on geographies consisting of 209,706,928 people shows a significant positive correlation between the proportion of Immigrants from Israel and labor force participation rate among population between the ages 16 and 19 in the United States with a correlation coefficient (R) of 0.612 and weighted average of 30.5%, a difference of 7.6%.
In Labor Force | Age 16-19 Correlation Summary
| Measurement | Okinawan | Immigrants from Israel |
| Minimum | 7.1% | 6.1% |
| Maximum | 73.4% | 100.0% |
| Range | 66.3% | 93.9% |
| Mean | 34.3% | 28.4% |
| Median | 33.9% | 25.4% |
| Interquartile 25% (IQ1) | 27.5% | 21.8% |
| Interquartile 75% (IQ3) | 39.4% | 30.0% |
| Interquartile Range (IQR) | 11.9% | 8.2% |
| Standard Deviation (Sample) | 11.8% | 18.6% |
| Standard Deviation (Population) | 11.8% | 18.4% |
Similar Demographics by In Labor Force | Age 16-19
Demographics Similar to Okinawans by In Labor Force | Age 16-19
In terms of in labor force | age 16-19, the demographic groups most similar to Okinawans are Belizean (32.8%, a difference of 0.14%), Immigrants from Argentina (32.9%, a difference of 0.24%), Armenian (32.9%, a difference of 0.39%), Iranian (33.0%, a difference of 0.63%), and Immigrants from Dominica (32.5%, a difference of 1.0%).
| Demographics | Rating | Rank | In Labor Force | Age 16-19 |
| Argentineans | 0.1 /100 | #294 | Tragic 33.3% |
| Yup'ik | 0.1 /100 | #295 | Tragic 33.3% |
| Jamaicans | 0.1 /100 | #296 | Tragic 33.2% |
| Immigrants | Haiti | 0.1 /100 | #297 | Tragic 33.2% |
| Iranians | 0.0 /100 | #298 | Tragic 33.0% |
| Armenians | 0.0 /100 | #299 | Tragic 32.9% |
| Immigrants | Argentina | 0.0 /100 | #300 | Tragic 32.9% |
| Okinawans | 0.0 /100 | #301 | Tragic 32.8% |
| Belizeans | 0.0 /100 | #302 | Tragic 32.8% |
| Immigrants | Dominica | 0.0 /100 | #303 | Tragic 32.5% |
| Israelis | 0.0 /100 | #304 | Tragic 32.4% |
| Nicaraguans | 0.0 /100 | #305 | Tragic 32.4% |
| Spanish American Indians | 0.0 /100 | #306 | Tragic 32.4% |
| Immigrants | Jamaica | 0.0 /100 | #307 | Tragic 32.2% |
| Navajo | 0.0 /100 | #308 | Tragic 32.1% |
Demographics Similar to Immigrants from Israel by In Labor Force | Age 16-19
In terms of in labor force | age 16-19, the demographic groups most similar to Immigrants from Israel are Immigrants from Hong Kong (30.5%, a difference of 0.020%), Puerto Rican (30.3%, a difference of 0.44%), Immigrants from Cuba (30.2%, a difference of 0.77%), Immigrants from Trinidad and Tobago (30.2%, a difference of 1.1%), and Immigrants from Bangladesh (30.0%, a difference of 1.4%).
| Demographics | Rating | Rank | In Labor Force | Age 16-19 |
| Immigrants | China | 0.0 /100 | #325 | Tragic 31.1% |
| Immigrants | Dominican Republic | 0.0 /100 | #326 | Tragic 31.1% |
| Immigrants | Taiwan | 0.0 /100 | #327 | Tragic 31.0% |
| Immigrants | Ecuador | 0.0 /100 | #328 | Tragic 31.0% |
| Barbadians | 0.0 /100 | #329 | Tragic 31.0% |
| Lumbee | 0.0 /100 | #330 | Tragic 31.0% |
| Trinidadians and Tobagonians | 0.0 /100 | #331 | Tragic 30.9% |
| Immigrants | Israel | 0.0 /100 | #332 | Tragic 30.5% |
| Immigrants | Hong Kong | 0.0 /100 | #333 | Tragic 30.5% |
| Puerto Ricans | 0.0 /100 | #334 | Tragic 30.3% |
| Immigrants | Cuba | 0.0 /100 | #335 | Tragic 30.2% |
| Immigrants | Trinidad and Tobago | 0.0 /100 | #336 | Tragic 30.2% |
| Immigrants | Bangladesh | 0.0 /100 | #337 | Tragic 30.0% |
| Vietnamese | 0.0 /100 | #338 | Tragic 29.6% |
| Immigrants | Uzbekistan | 0.0 /100 | #339 | Tragic 29.2% |