Immigrants from Europe vs Immigrants from Israel In Labor Force | Age 16-19
COMPARE
Immigrants from Europe
Immigrants from Israel
In Labor Force | Age 16-19
In Labor Force | Age 16-19 Comparison
Immigrants from Europe
Immigrants from Israel
36.2%
IN LABOR FORCE | AGE 16-19
31.8/ 100
METRIC RATING
188th/ 347
METRIC RANK
30.5%
IN LABOR FORCE | AGE 16-19
0.0/ 100
METRIC RATING
332nd/ 347
METRIC RANK
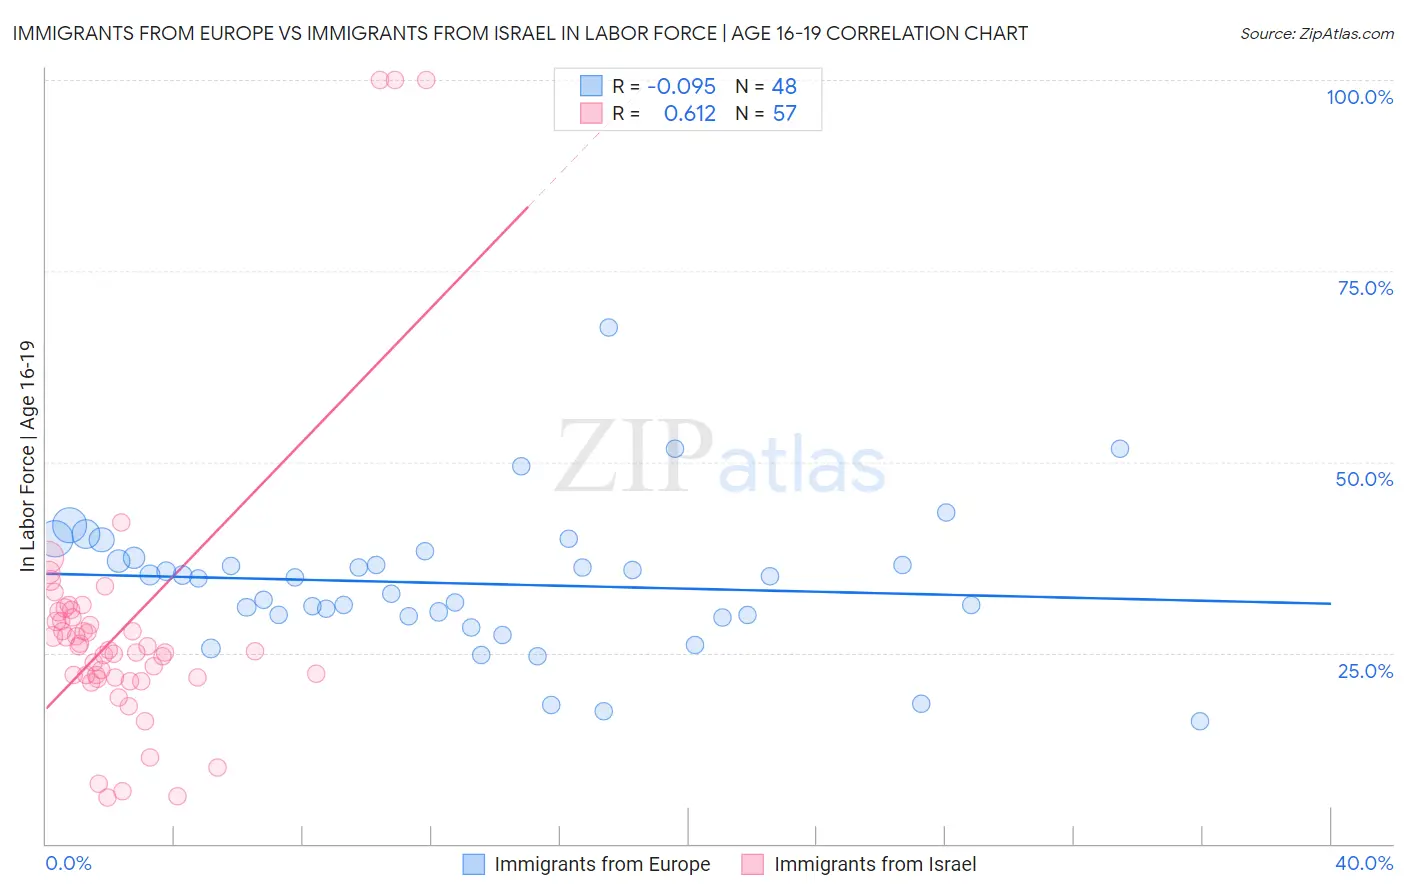
Immigrants from Europe vs Immigrants from Israel In Labor Force | Age 16-19 Correlation Chart
The statistical analysis conducted on geographies consisting of 544,647,771 people shows a slight negative correlation between the proportion of Immigrants from Europe and labor force participation rate among population between the ages 16 and 19 in the United States with a correlation coefficient (R) of -0.095 and weighted average of 36.2%. Similarly, the statistical analysis conducted on geographies consisting of 209,706,928 people shows a significant positive correlation between the proportion of Immigrants from Israel and labor force participation rate among population between the ages 16 and 19 in the United States with a correlation coefficient (R) of 0.612 and weighted average of 30.5%, a difference of 18.8%.
In Labor Force | Age 16-19 Correlation Summary
| Measurement | Immigrants from Europe | Immigrants from Israel |
| Minimum | 16.1% | 6.1% |
| Maximum | 67.6% | 100.0% |
| Range | 51.5% | 93.9% |
| Mean | 34.1% | 28.4% |
| Median | 34.8% | 25.4% |
| Interquartile 25% (IQ1) | 29.9% | 21.8% |
| Interquartile 75% (IQ3) | 37.2% | 30.0% |
| Interquartile Range (IQR) | 7.3% | 8.2% |
| Standard Deviation (Sample) | 9.2% | 18.6% |
| Standard Deviation (Population) | 9.1% | 18.4% |
Similar Demographics by In Labor Force | Age 16-19
Demographics Similar to Immigrants from Europe by In Labor Force | Age 16-19
In terms of in labor force | age 16-19, the demographic groups most similar to Immigrants from Europe are Immigrants from Romania (36.3%, a difference of 0.13%), Immigrants from Afghanistan (36.3%, a difference of 0.13%), Immigrants from Hungary (36.2%, a difference of 0.18%), Panamanian (36.1%, a difference of 0.19%), and Bhutanese (36.3%, a difference of 0.20%).
| Demographics | Rating | Rank | In Labor Force | Age 16-19 |
| Jordanians | 39.6 /100 | #181 | Fair 36.4% |
| Immigrants | Italy | 39.1 /100 | #182 | Fair 36.4% |
| Eastern Europeans | 38.8 /100 | #183 | Fair 36.4% |
| Costa Ricans | 36.1 /100 | #184 | Fair 36.3% |
| Bhutanese | 35.3 /100 | #185 | Fair 36.3% |
| Immigrants | Romania | 34.0 /100 | #186 | Fair 36.3% |
| Immigrants | Afghanistan | 34.0 /100 | #187 | Fair 36.3% |
| Immigrants | Europe | 31.8 /100 | #188 | Fair 36.2% |
| Immigrants | Hungary | 28.8 /100 | #189 | Fair 36.2% |
| Panamanians | 28.6 /100 | #190 | Fair 36.1% |
| Immigrants | Croatia | 27.5 /100 | #191 | Fair 36.1% |
| Afghans | 25.7 /100 | #192 | Fair 36.1% |
| Immigrants | Denmark | 25.0 /100 | #193 | Fair 36.1% |
| Nigerians | 24.6 /100 | #194 | Fair 36.1% |
| Bolivians | 23.3 /100 | #195 | Fair 36.0% |
Demographics Similar to Immigrants from Israel by In Labor Force | Age 16-19
In terms of in labor force | age 16-19, the demographic groups most similar to Immigrants from Israel are Immigrants from Hong Kong (30.5%, a difference of 0.020%), Puerto Rican (30.3%, a difference of 0.44%), Immigrants from Cuba (30.2%, a difference of 0.77%), Immigrants from Trinidad and Tobago (30.2%, a difference of 1.1%), and Immigrants from Bangladesh (30.0%, a difference of 1.4%).
| Demographics | Rating | Rank | In Labor Force | Age 16-19 |
| Immigrants | China | 0.0 /100 | #325 | Tragic 31.1% |
| Immigrants | Dominican Republic | 0.0 /100 | #326 | Tragic 31.1% |
| Immigrants | Taiwan | 0.0 /100 | #327 | Tragic 31.0% |
| Immigrants | Ecuador | 0.0 /100 | #328 | Tragic 31.0% |
| Barbadians | 0.0 /100 | #329 | Tragic 31.0% |
| Lumbee | 0.0 /100 | #330 | Tragic 31.0% |
| Trinidadians and Tobagonians | 0.0 /100 | #331 | Tragic 30.9% |
| Immigrants | Israel | 0.0 /100 | #332 | Tragic 30.5% |
| Immigrants | Hong Kong | 0.0 /100 | #333 | Tragic 30.5% |
| Puerto Ricans | 0.0 /100 | #334 | Tragic 30.3% |
| Immigrants | Cuba | 0.0 /100 | #335 | Tragic 30.2% |
| Immigrants | Trinidad and Tobago | 0.0 /100 | #336 | Tragic 30.2% |
| Immigrants | Bangladesh | 0.0 /100 | #337 | Tragic 30.0% |
| Vietnamese | 0.0 /100 | #338 | Tragic 29.6% |
| Immigrants | Uzbekistan | 0.0 /100 | #339 | Tragic 29.2% |