Okinawan vs Marshallese In Labor Force | Age 16-19
COMPARE
Okinawan
Marshallese
In Labor Force | Age 16-19
In Labor Force | Age 16-19 Comparison
Okinawans
Marshallese
32.8%
IN LABOR FORCE | AGE 16-19
0.0/ 100
METRIC RATING
301st/ 347
METRIC RANK
39.5%
IN LABOR FORCE | AGE 16-19
99.8/ 100
METRIC RATING
79th/ 347
METRIC RANK
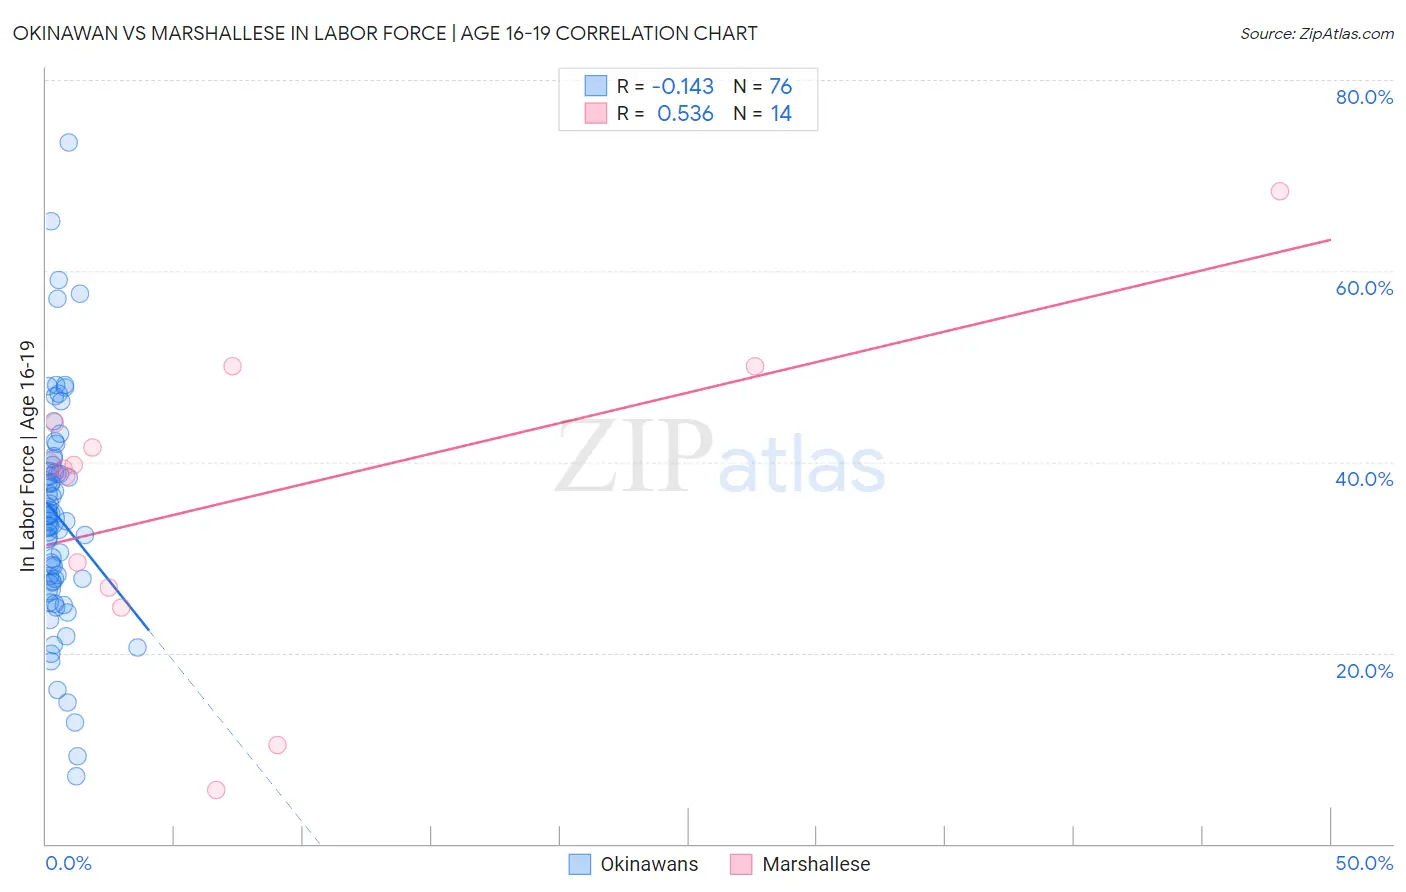
Okinawan vs Marshallese In Labor Force | Age 16-19 Correlation Chart
The statistical analysis conducted on geographies consisting of 73,748,077 people shows a poor negative correlation between the proportion of Okinawans and labor force participation rate among population between the ages 16 and 19 in the United States with a correlation coefficient (R) of -0.143 and weighted average of 32.8%. Similarly, the statistical analysis conducted on geographies consisting of 14,757,218 people shows a substantial positive correlation between the proportion of Marshallese and labor force participation rate among population between the ages 16 and 19 in the United States with a correlation coefficient (R) of 0.536 and weighted average of 39.5%, a difference of 20.3%.
In Labor Force | Age 16-19 Correlation Summary
| Measurement | Okinawan | Marshallese |
| Minimum | 7.1% | 5.6% |
| Maximum | 73.4% | 68.4% |
| Range | 66.3% | 62.8% |
| Mean | 34.3% | 36.3% |
| Median | 33.9% | 39.5% |
| Interquartile 25% (IQ1) | 27.5% | 26.8% |
| Interquartile 75% (IQ3) | 39.4% | 44.1% |
| Interquartile Range (IQR) | 11.9% | 17.3% |
| Standard Deviation (Sample) | 11.8% | 16.2% |
| Standard Deviation (Population) | 11.8% | 15.6% |
Similar Demographics by In Labor Force | Age 16-19
Demographics Similar to Okinawans by In Labor Force | Age 16-19
In terms of in labor force | age 16-19, the demographic groups most similar to Okinawans are Belizean (32.8%, a difference of 0.14%), Immigrants from Argentina (32.9%, a difference of 0.24%), Armenian (32.9%, a difference of 0.39%), Iranian (33.0%, a difference of 0.63%), and Immigrants from Dominica (32.5%, a difference of 1.0%).
| Demographics | Rating | Rank | In Labor Force | Age 16-19 |
| Argentineans | 0.1 /100 | #294 | Tragic 33.3% |
| Yup'ik | 0.1 /100 | #295 | Tragic 33.3% |
| Jamaicans | 0.1 /100 | #296 | Tragic 33.2% |
| Immigrants | Haiti | 0.1 /100 | #297 | Tragic 33.2% |
| Iranians | 0.0 /100 | #298 | Tragic 33.0% |
| Armenians | 0.0 /100 | #299 | Tragic 32.9% |
| Immigrants | Argentina | 0.0 /100 | #300 | Tragic 32.9% |
| Okinawans | 0.0 /100 | #301 | Tragic 32.8% |
| Belizeans | 0.0 /100 | #302 | Tragic 32.8% |
| Immigrants | Dominica | 0.0 /100 | #303 | Tragic 32.5% |
| Israelis | 0.0 /100 | #304 | Tragic 32.4% |
| Nicaraguans | 0.0 /100 | #305 | Tragic 32.4% |
| Spanish American Indians | 0.0 /100 | #306 | Tragic 32.4% |
| Immigrants | Jamaica | 0.0 /100 | #307 | Tragic 32.2% |
| Navajo | 0.0 /100 | #308 | Tragic 32.1% |
Demographics Similar to Marshallese by In Labor Force | Age 16-19
In terms of in labor force | age 16-19, the demographic groups most similar to Marshallese are Austrian (39.5%, a difference of 0.13%), Immigrants from Iraq (39.4%, a difference of 0.18%), Shoshone (39.3%, a difference of 0.46%), Immigrants from Portugal (39.7%, a difference of 0.52%), and Basque (39.3%, a difference of 0.52%).
| Demographics | Rating | Rank | In Labor Force | Age 16-19 |
| Iroquois | 99.9 /100 | #72 | Exceptional 39.9% |
| Immigrants | Middle Africa | 99.9 /100 | #73 | Exceptional 39.9% |
| Hungarians | 99.9 /100 | #74 | Exceptional 39.8% |
| French American Indians | 99.9 /100 | #75 | Exceptional 39.8% |
| Malaysians | 99.9 /100 | #76 | Exceptional 39.7% |
| Immigrants | Portugal | 99.9 /100 | #77 | Exceptional 39.7% |
| Austrians | 99.8 /100 | #78 | Exceptional 39.5% |
| Marshallese | 99.8 /100 | #79 | Exceptional 39.5% |
| Immigrants | Iraq | 99.8 /100 | #80 | Exceptional 39.4% |
| Shoshone | 99.7 /100 | #81 | Exceptional 39.3% |
| Basques | 99.7 /100 | #82 | Exceptional 39.3% |
| Spanish | 99.7 /100 | #83 | Exceptional 39.3% |
| Immigrants | Uganda | 99.7 /100 | #84 | Exceptional 39.2% |
| Creek | 99.6 /100 | #85 | Exceptional 39.1% |
| Samoans | 99.6 /100 | #86 | Exceptional 39.1% |