Okinawan vs Osage In Labor Force | Age 16-19
COMPARE
Okinawan
Osage
In Labor Force | Age 16-19
In Labor Force | Age 16-19 Comparison
Okinawans
Osage
32.8%
IN LABOR FORCE | AGE 16-19
0.0/ 100
METRIC RATING
301st/ 347
METRIC RANK
39.0%
IN LABOR FORCE | AGE 16-19
99.4/ 100
METRIC RATING
92nd/ 347
METRIC RANK
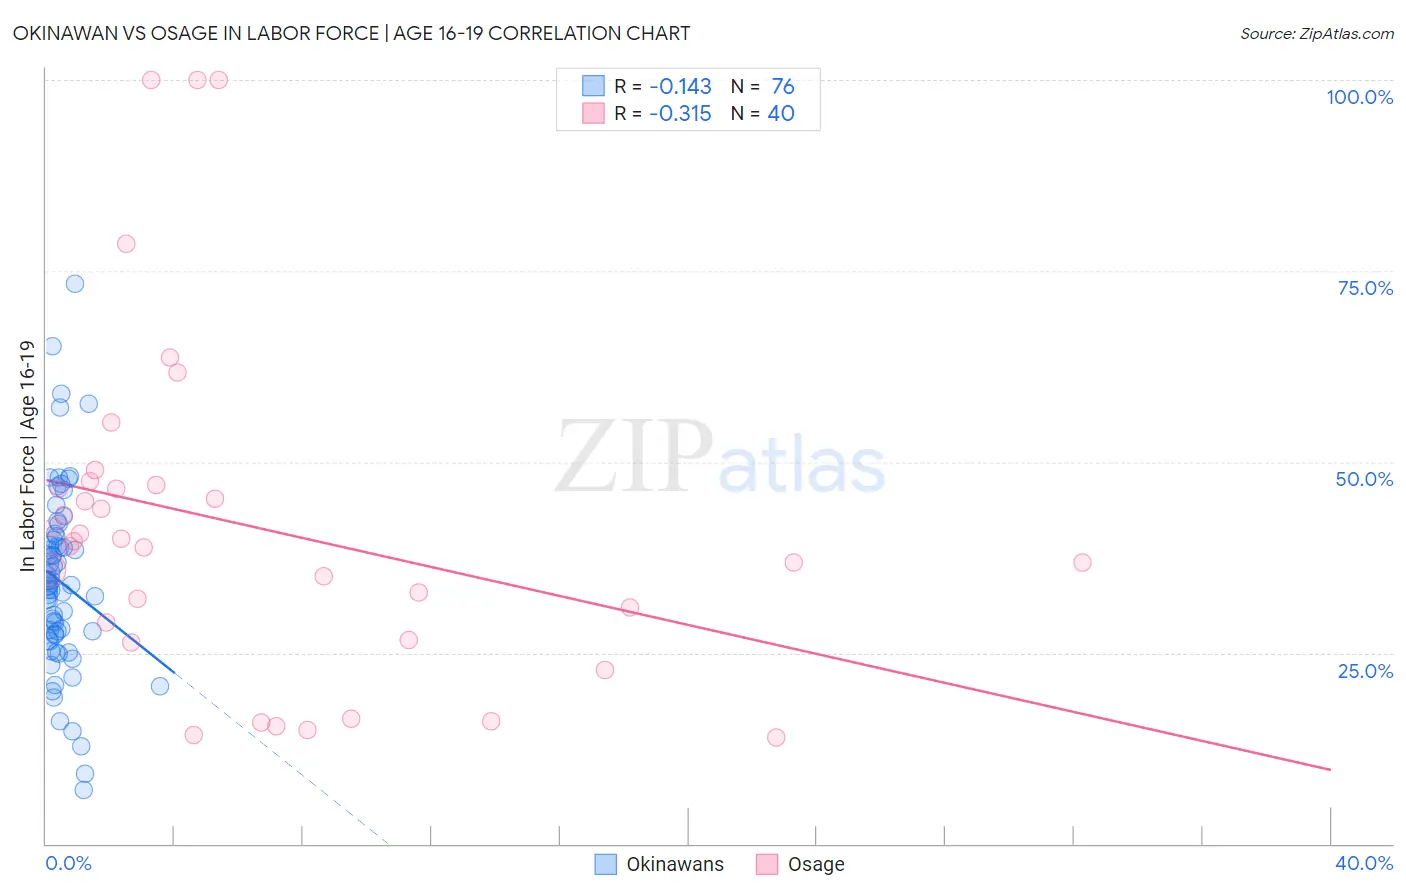
Okinawan vs Osage In Labor Force | Age 16-19 Correlation Chart
The statistical analysis conducted on geographies consisting of 73,748,077 people shows a poor negative correlation between the proportion of Okinawans and labor force participation rate among population between the ages 16 and 19 in the United States with a correlation coefficient (R) of -0.143 and weighted average of 32.8%. Similarly, the statistical analysis conducted on geographies consisting of 91,776,050 people shows a mild negative correlation between the proportion of Osage and labor force participation rate among population between the ages 16 and 19 in the United States with a correlation coefficient (R) of -0.315 and weighted average of 39.0%, a difference of 18.7%.
In Labor Force | Age 16-19 Correlation Summary
| Measurement | Okinawan | Osage |
| Minimum | 7.1% | 13.9% |
| Maximum | 73.4% | 100.0% |
| Range | 66.3% | 86.1% |
| Mean | 34.3% | 41.6% |
| Median | 33.9% | 39.3% |
| Interquartile 25% (IQ1) | 27.5% | 27.8% |
| Interquartile 75% (IQ3) | 39.4% | 46.7% |
| Interquartile Range (IQR) | 11.9% | 19.0% |
| Standard Deviation (Sample) | 11.8% | 22.1% |
| Standard Deviation (Population) | 11.8% | 21.9% |
Similar Demographics by In Labor Force | Age 16-19
Demographics Similar to Okinawans by In Labor Force | Age 16-19
In terms of in labor force | age 16-19, the demographic groups most similar to Okinawans are Belizean (32.8%, a difference of 0.14%), Immigrants from Argentina (32.9%, a difference of 0.24%), Armenian (32.9%, a difference of 0.39%), Iranian (33.0%, a difference of 0.63%), and Immigrants from Dominica (32.5%, a difference of 1.0%).
| Demographics | Rating | Rank | In Labor Force | Age 16-19 |
| Argentineans | 0.1 /100 | #294 | Tragic 33.3% |
| Yup'ik | 0.1 /100 | #295 | Tragic 33.3% |
| Jamaicans | 0.1 /100 | #296 | Tragic 33.2% |
| Immigrants | Haiti | 0.1 /100 | #297 | Tragic 33.2% |
| Iranians | 0.0 /100 | #298 | Tragic 33.0% |
| Armenians | 0.0 /100 | #299 | Tragic 32.9% |
| Immigrants | Argentina | 0.0 /100 | #300 | Tragic 32.9% |
| Okinawans | 0.0 /100 | #301 | Tragic 32.8% |
| Belizeans | 0.0 /100 | #302 | Tragic 32.8% |
| Immigrants | Dominica | 0.0 /100 | #303 | Tragic 32.5% |
| Israelis | 0.0 /100 | #304 | Tragic 32.4% |
| Nicaraguans | 0.0 /100 | #305 | Tragic 32.4% |
| Spanish American Indians | 0.0 /100 | #306 | Tragic 32.4% |
| Immigrants | Jamaica | 0.0 /100 | #307 | Tragic 32.2% |
| Navajo | 0.0 /100 | #308 | Tragic 32.1% |
Demographics Similar to Osage by In Labor Force | Age 16-19
In terms of in labor force | age 16-19, the demographic groups most similar to Osage are Blackfeet (38.9%, a difference of 0.060%), Immigrants from Canada (38.9%, a difference of 0.060%), Spanish American (39.0%, a difference of 0.090%), Immigrants from North America (38.9%, a difference of 0.15%), and Latvian (38.9%, a difference of 0.18%).
| Demographics | Rating | Rank | In Labor Force | Age 16-19 |
| Creek | 99.6 /100 | #85 | Exceptional 39.1% |
| Samoans | 99.6 /100 | #86 | Exceptional 39.1% |
| Immigrants | Germany | 99.6 /100 | #87 | Exceptional 39.1% |
| Puget Sound Salish | 99.6 /100 | #88 | Exceptional 39.1% |
| Alaska Natives | 99.6 /100 | #89 | Exceptional 39.1% |
| Immigrants | Burma/Myanmar | 99.5 /100 | #90 | Exceptional 39.0% |
| Spanish Americans | 99.5 /100 | #91 | Exceptional 39.0% |
| Osage | 99.4 /100 | #92 | Exceptional 39.0% |
| Blackfeet | 99.4 /100 | #93 | Exceptional 38.9% |
| Immigrants | Canada | 99.4 /100 | #94 | Exceptional 38.9% |
| Immigrants | North America | 99.4 /100 | #95 | Exceptional 38.9% |
| Latvians | 99.4 /100 | #96 | Exceptional 38.9% |
| Greeks | 99.3 /100 | #97 | Exceptional 38.9% |
| Ugandans | 99.3 /100 | #98 | Exceptional 38.9% |
| Immigrants | North Macedonia | 99.3 /100 | #99 | Exceptional 38.9% |