Nepalese vs Immigrants from Israel In Labor Force | Age 16-19
COMPARE
Nepalese
Immigrants from Israel
In Labor Force | Age 16-19
In Labor Force | Age 16-19 Comparison
Nepalese
Immigrants from Israel
33.5%
IN LABOR FORCE | AGE 16-19
0.1/ 100
METRIC RATING
287th/ 347
METRIC RANK
30.5%
IN LABOR FORCE | AGE 16-19
0.0/ 100
METRIC RATING
332nd/ 347
METRIC RANK
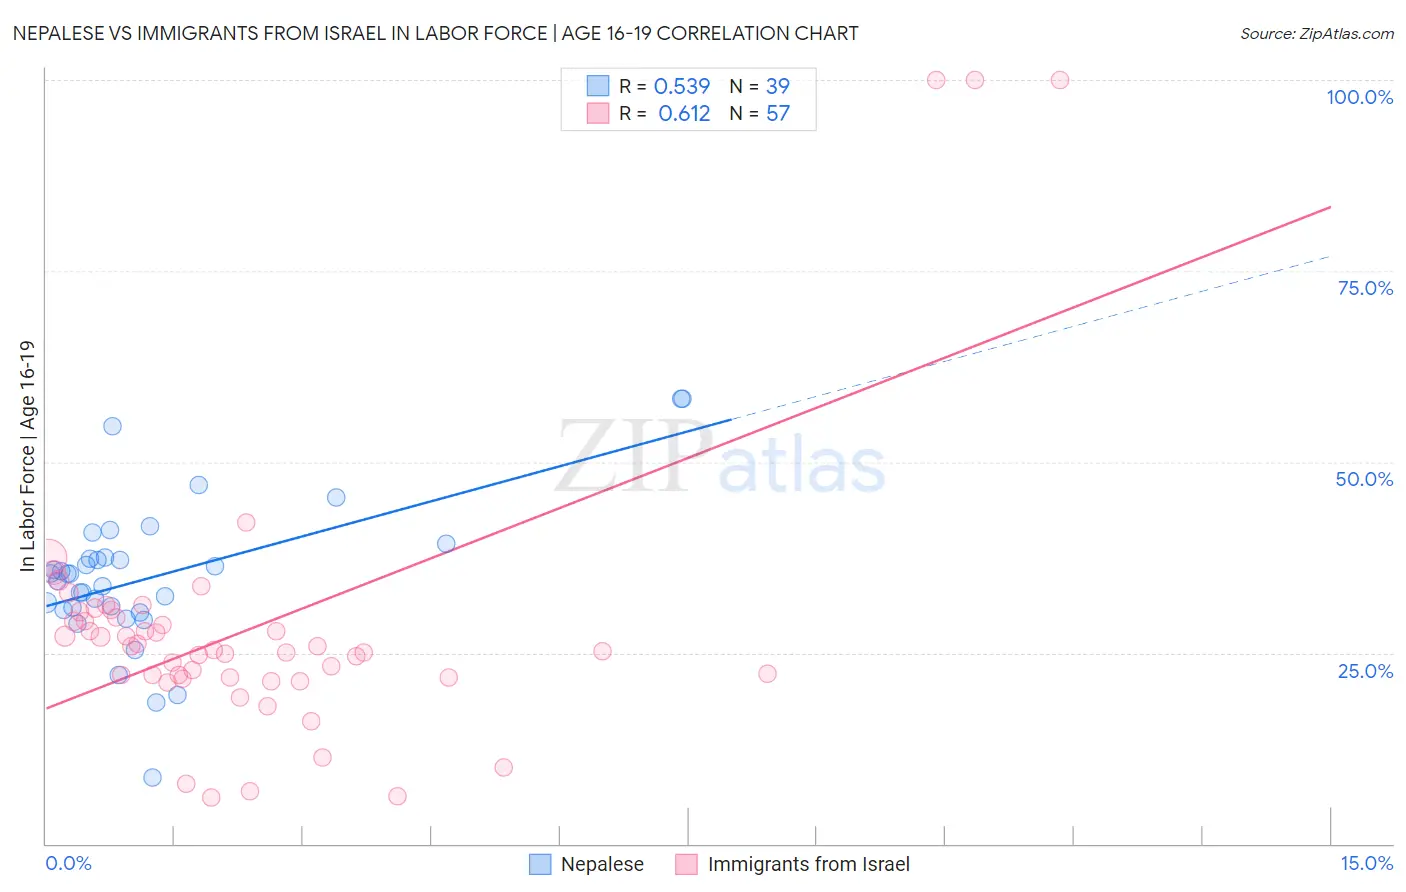
Nepalese vs Immigrants from Israel In Labor Force | Age 16-19 Correlation Chart
The statistical analysis conducted on geographies consisting of 24,520,458 people shows a substantial positive correlation between the proportion of Nepalese and labor force participation rate among population between the ages 16 and 19 in the United States with a correlation coefficient (R) of 0.539 and weighted average of 33.5%. Similarly, the statistical analysis conducted on geographies consisting of 209,706,928 people shows a significant positive correlation between the proportion of Immigrants from Israel and labor force participation rate among population between the ages 16 and 19 in the United States with a correlation coefficient (R) of 0.612 and weighted average of 30.5%, a difference of 10.0%.
In Labor Force | Age 16-19 Correlation Summary
| Measurement | Nepalese | Immigrants from Israel |
| Minimum | 8.7% | 6.1% |
| Maximum | 58.3% | 100.0% |
| Range | 49.6% | 93.9% |
| Mean | 34.9% | 28.4% |
| Median | 35.3% | 25.4% |
| Interquartile 25% (IQ1) | 30.6% | 21.8% |
| Interquartile 75% (IQ3) | 37.4% | 30.0% |
| Interquartile Range (IQR) | 6.8% | 8.2% |
| Standard Deviation (Sample) | 9.7% | 18.6% |
| Standard Deviation (Population) | 9.5% | 18.4% |
Similar Demographics by In Labor Force | Age 16-19
Demographics Similar to Nepalese by In Labor Force | Age 16-19
In terms of in labor force | age 16-19, the demographic groups most similar to Nepalese are Immigrants from Indonesia (33.5%, a difference of 0.040%), Immigrants from Singapore (33.5%, a difference of 0.040%), Immigrants from Colombia (33.5%, a difference of 0.18%), South American (33.6%, a difference of 0.23%), and Immigrants from Belarus (33.4%, a difference of 0.25%).
| Demographics | Rating | Rank | In Labor Force | Age 16-19 |
| Taiwanese | 0.3 /100 | #280 | Tragic 33.8% |
| Cypriots | 0.3 /100 | #281 | Tragic 33.8% |
| Immigrants | Korea | 0.3 /100 | #282 | Tragic 33.8% |
| Immigrants | Venezuela | 0.2 /100 | #283 | Tragic 33.7% |
| Immigrants | Spain | 0.2 /100 | #284 | Tragic 33.7% |
| U.S. Virgin Islanders | 0.2 /100 | #285 | Tragic 33.6% |
| South Americans | 0.2 /100 | #286 | Tragic 33.6% |
| Nepalese | 0.1 /100 | #287 | Tragic 33.5% |
| Immigrants | Indonesia | 0.1 /100 | #288 | Tragic 33.5% |
| Immigrants | Singapore | 0.1 /100 | #289 | Tragic 33.5% |
| Immigrants | Colombia | 0.1 /100 | #290 | Tragic 33.5% |
| Immigrants | Belarus | 0.1 /100 | #291 | Tragic 33.4% |
| Haitians | 0.1 /100 | #292 | Tragic 33.4% |
| Immigrants | South America | 0.1 /100 | #293 | Tragic 33.3% |
| Argentineans | 0.1 /100 | #294 | Tragic 33.3% |
Demographics Similar to Immigrants from Israel by In Labor Force | Age 16-19
In terms of in labor force | age 16-19, the demographic groups most similar to Immigrants from Israel are Immigrants from Hong Kong (30.5%, a difference of 0.020%), Puerto Rican (30.3%, a difference of 0.44%), Immigrants from Cuba (30.2%, a difference of 0.77%), Immigrants from Trinidad and Tobago (30.2%, a difference of 1.1%), and Immigrants from Bangladesh (30.0%, a difference of 1.4%).
| Demographics | Rating | Rank | In Labor Force | Age 16-19 |
| Immigrants | China | 0.0 /100 | #325 | Tragic 31.1% |
| Immigrants | Dominican Republic | 0.0 /100 | #326 | Tragic 31.1% |
| Immigrants | Taiwan | 0.0 /100 | #327 | Tragic 31.0% |
| Immigrants | Ecuador | 0.0 /100 | #328 | Tragic 31.0% |
| Barbadians | 0.0 /100 | #329 | Tragic 31.0% |
| Lumbee | 0.0 /100 | #330 | Tragic 31.0% |
| Trinidadians and Tobagonians | 0.0 /100 | #331 | Tragic 30.9% |
| Immigrants | Israel | 0.0 /100 | #332 | Tragic 30.5% |
| Immigrants | Hong Kong | 0.0 /100 | #333 | Tragic 30.5% |
| Puerto Ricans | 0.0 /100 | #334 | Tragic 30.3% |
| Immigrants | Cuba | 0.0 /100 | #335 | Tragic 30.2% |
| Immigrants | Trinidad and Tobago | 0.0 /100 | #336 | Tragic 30.2% |
| Immigrants | Bangladesh | 0.0 /100 | #337 | Tragic 30.0% |
| Vietnamese | 0.0 /100 | #338 | Tragic 29.6% |
| Immigrants | Uzbekistan | 0.0 /100 | #339 | Tragic 29.2% |