Okinawan vs Immigrants from Caribbean In Labor Force | Age 16-19
COMPARE
Okinawan
Immigrants from Caribbean
In Labor Force | Age 16-19
In Labor Force | Age 16-19 Comparison
Okinawans
Immigrants from Caribbean
32.8%
IN LABOR FORCE | AGE 16-19
0.0/ 100
METRIC RATING
301st/ 347
METRIC RANK
31.2%
IN LABOR FORCE | AGE 16-19
0.0/ 100
METRIC RATING
323rd/ 347
METRIC RANK
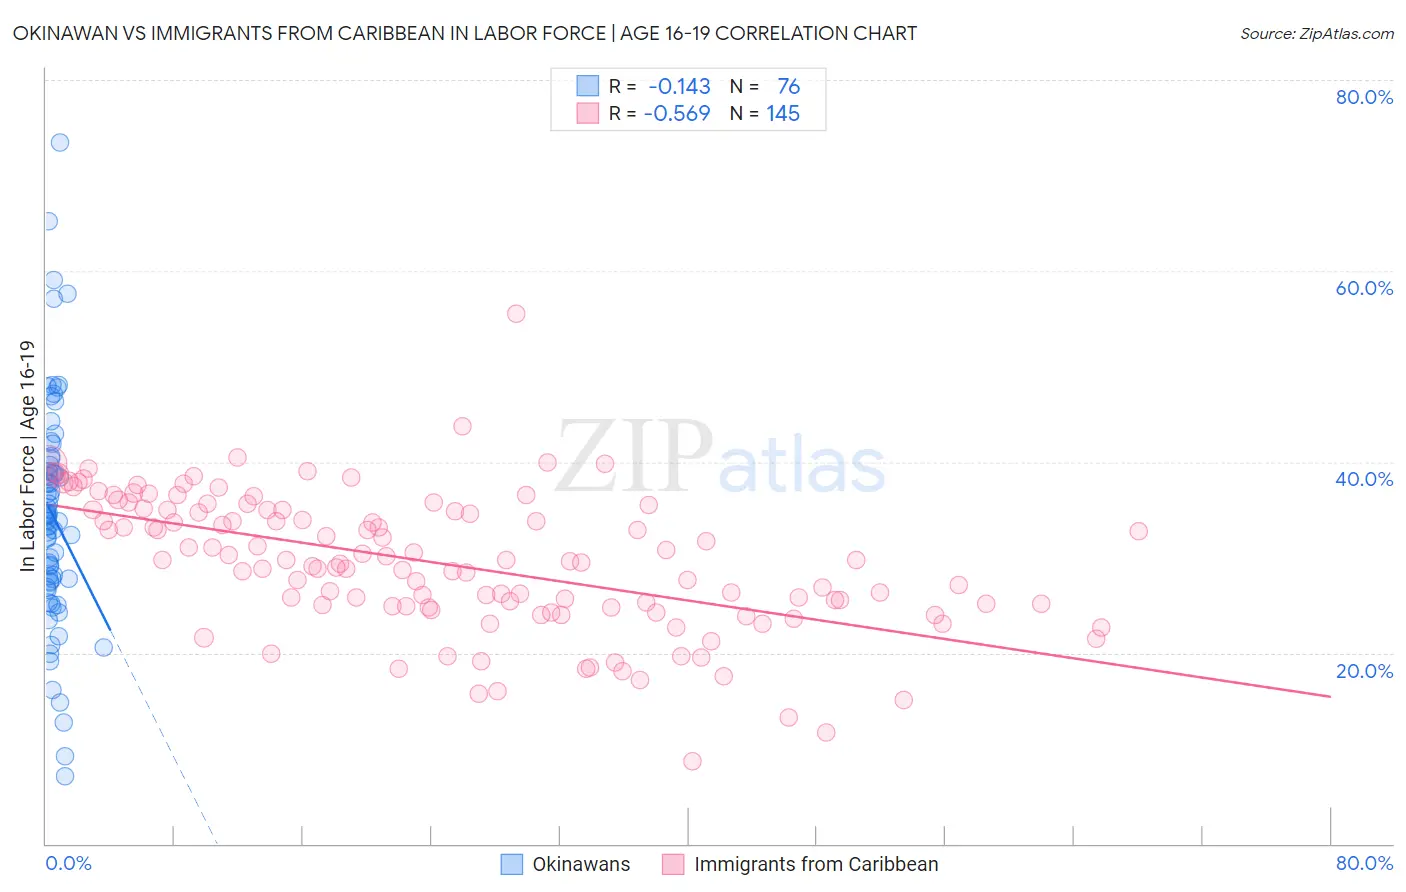
Okinawan vs Immigrants from Caribbean In Labor Force | Age 16-19 Correlation Chart
The statistical analysis conducted on geographies consisting of 73,748,077 people shows a poor negative correlation between the proportion of Okinawans and labor force participation rate among population between the ages 16 and 19 in the United States with a correlation coefficient (R) of -0.143 and weighted average of 32.8%. Similarly, the statistical analysis conducted on geographies consisting of 448,967,505 people shows a substantial negative correlation between the proportion of Immigrants from Caribbean and labor force participation rate among population between the ages 16 and 19 in the United States with a correlation coefficient (R) of -0.569 and weighted average of 31.2%, a difference of 5.0%.
In Labor Force | Age 16-19 Correlation Summary
| Measurement | Okinawan | Immigrants from Caribbean |
| Minimum | 7.1% | 8.6% |
| Maximum | 73.4% | 55.5% |
| Range | 66.3% | 46.9% |
| Mean | 34.3% | 29.4% |
| Median | 33.9% | 29.6% |
| Interquartile 25% (IQ1) | 27.5% | 24.8% |
| Interquartile 75% (IQ3) | 39.4% | 35.0% |
| Interquartile Range (IQR) | 11.9% | 10.1% |
| Standard Deviation (Sample) | 11.8% | 7.2% |
| Standard Deviation (Population) | 11.8% | 7.2% |
Similar Demographics by In Labor Force | Age 16-19
Demographics Similar to Okinawans by In Labor Force | Age 16-19
In terms of in labor force | age 16-19, the demographic groups most similar to Okinawans are Belizean (32.8%, a difference of 0.14%), Immigrants from Argentina (32.9%, a difference of 0.24%), Armenian (32.9%, a difference of 0.39%), Iranian (33.0%, a difference of 0.63%), and Immigrants from Dominica (32.5%, a difference of 1.0%).
| Demographics | Rating | Rank | In Labor Force | Age 16-19 |
| Argentineans | 0.1 /100 | #294 | Tragic 33.3% |
| Yup'ik | 0.1 /100 | #295 | Tragic 33.3% |
| Jamaicans | 0.1 /100 | #296 | Tragic 33.2% |
| Immigrants | Haiti | 0.1 /100 | #297 | Tragic 33.2% |
| Iranians | 0.0 /100 | #298 | Tragic 33.0% |
| Armenians | 0.0 /100 | #299 | Tragic 32.9% |
| Immigrants | Argentina | 0.0 /100 | #300 | Tragic 32.9% |
| Okinawans | 0.0 /100 | #301 | Tragic 32.8% |
| Belizeans | 0.0 /100 | #302 | Tragic 32.8% |
| Immigrants | Dominica | 0.0 /100 | #303 | Tragic 32.5% |
| Israelis | 0.0 /100 | #304 | Tragic 32.4% |
| Nicaraguans | 0.0 /100 | #305 | Tragic 32.4% |
| Spanish American Indians | 0.0 /100 | #306 | Tragic 32.4% |
| Immigrants | Jamaica | 0.0 /100 | #307 | Tragic 32.2% |
| Navajo | 0.0 /100 | #308 | Tragic 32.1% |
Demographics Similar to Immigrants from Caribbean by In Labor Force | Age 16-19
In terms of in labor force | age 16-19, the demographic groups most similar to Immigrants from Caribbean are Tohono O'odham (31.3%, a difference of 0.13%), Dominican (31.2%, a difference of 0.18%), West Indian (31.3%, a difference of 0.25%), Immigrants from China (31.1%, a difference of 0.33%), and Ecuadorian (31.4%, a difference of 0.48%).
| Demographics | Rating | Rank | In Labor Force | Age 16-19 |
| Filipinos | 0.0 /100 | #316 | Tragic 31.7% |
| Immigrants | Nicaragua | 0.0 /100 | #317 | Tragic 31.6% |
| Immigrants | Yemen | 0.0 /100 | #318 | Tragic 31.5% |
| Soviet Union | 0.0 /100 | #319 | Tragic 31.4% |
| Ecuadorians | 0.0 /100 | #320 | Tragic 31.4% |
| West Indians | 0.0 /100 | #321 | Tragic 31.3% |
| Tohono O'odham | 0.0 /100 | #322 | Tragic 31.3% |
| Immigrants | Caribbean | 0.0 /100 | #323 | Tragic 31.2% |
| Dominicans | 0.0 /100 | #324 | Tragic 31.2% |
| Immigrants | China | 0.0 /100 | #325 | Tragic 31.1% |
| Immigrants | Dominican Republic | 0.0 /100 | #326 | Tragic 31.1% |
| Immigrants | Taiwan | 0.0 /100 | #327 | Tragic 31.0% |
| Immigrants | Ecuador | 0.0 /100 | #328 | Tragic 31.0% |
| Barbadians | 0.0 /100 | #329 | Tragic 31.0% |
| Lumbee | 0.0 /100 | #330 | Tragic 31.0% |