Northern European vs Bahamian In Labor Force | Age > 16
COMPARE
Northern European
Bahamian
In Labor Force | Age > 16
In Labor Force | Age > 16 Comparison
Northern Europeans
Bahamians
64.7%
IN LABOR FORCE | AGE > 16
8.2/ 100
METRIC RATING
228th/ 347
METRIC RANK
64.2%
IN LABOR FORCE | AGE > 16
0.6/ 100
METRIC RATING
263rd/ 347
METRIC RANK
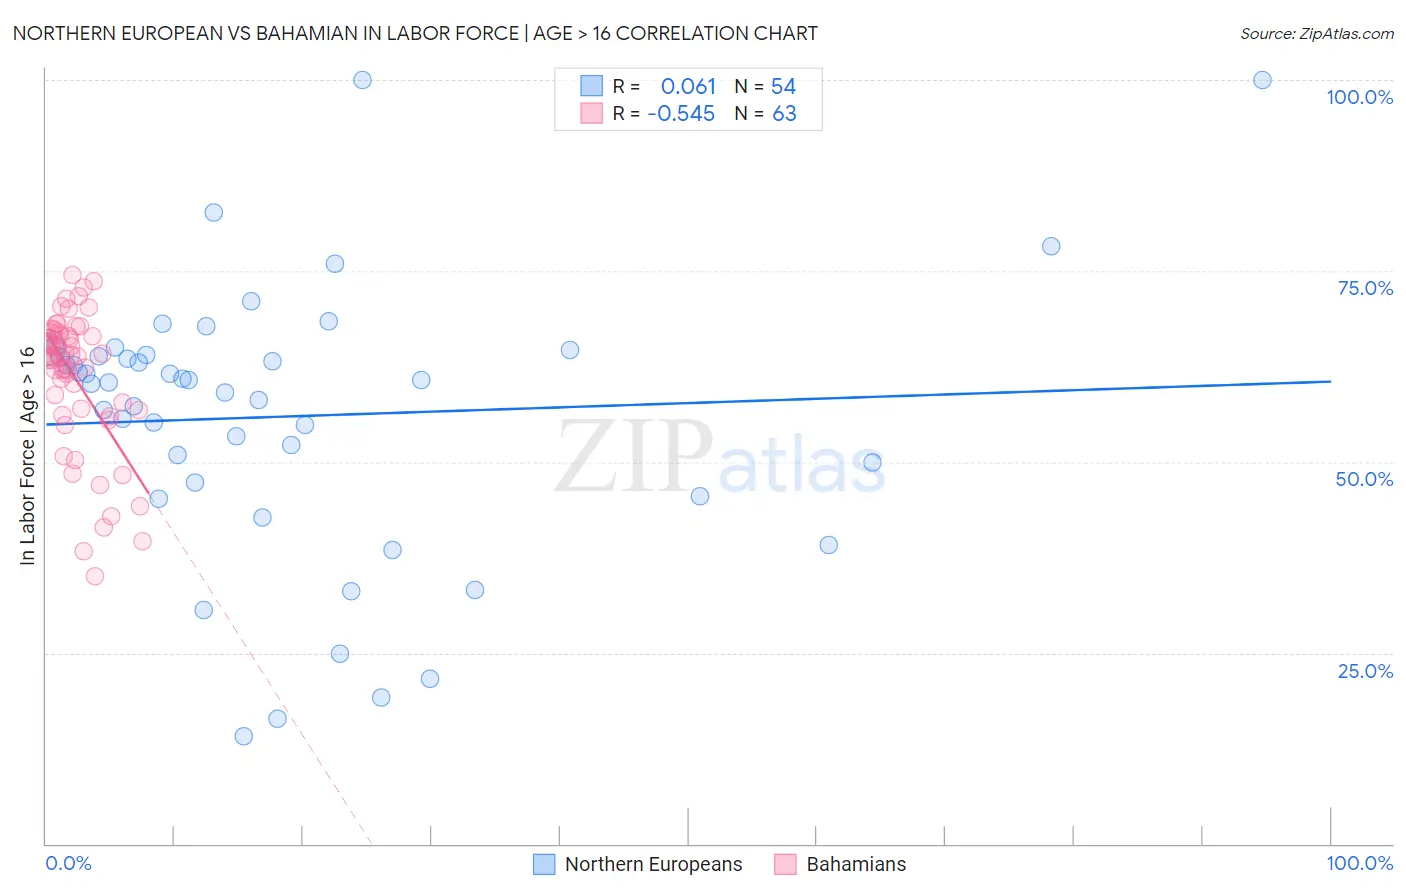
Northern European vs Bahamian In Labor Force | Age > 16 Correlation Chart
The statistical analysis conducted on geographies consisting of 406,102,680 people shows a slight positive correlation between the proportion of Northern Europeans and labor force participation rate among population ages 16 and over in the United States with a correlation coefficient (R) of 0.061 and weighted average of 64.7%. Similarly, the statistical analysis conducted on geographies consisting of 112,706,440 people shows a substantial negative correlation between the proportion of Bahamians and labor force participation rate among population ages 16 and over in the United States with a correlation coefficient (R) of -0.545 and weighted average of 64.2%, a difference of 0.75%.
In Labor Force | Age > 16 Correlation Summary
| Measurement | Northern European | Bahamian |
| Minimum | 14.1% | 35.0% |
| Maximum | 100.0% | 74.5% |
| Range | 85.9% | 39.5% |
| Mean | 55.9% | 61.0% |
| Median | 60.6% | 63.8% |
| Interquartile 25% (IQ1) | 47.3% | 56.8% |
| Interquartile 75% (IQ3) | 63.9% | 66.9% |
| Interquartile Range (IQR) | 16.6% | 10.1% |
| Standard Deviation (Sample) | 17.8% | 9.1% |
| Standard Deviation (Population) | 17.6% | 9.1% |
Similar Demographics by In Labor Force | Age > 16
Demographics Similar to Northern Europeans by In Labor Force | Age > 16
In terms of in labor force | age > 16, the demographic groups most similar to Northern Europeans are European (64.7%, a difference of 0.0%), Polish (64.7%, a difference of 0.0%), Immigrants from Jamaica (64.7%, a difference of 0.020%), Croatian (64.7%, a difference of 0.020%), and Hawaiian (64.7%, a difference of 0.040%).
| Demographics | Rating | Rank | In Labor Force | Age > 16 |
| Immigrants | Micronesia | 9.6 /100 | #221 | Tragic 64.7% |
| Hawaiians | 9.3 /100 | #222 | Tragic 64.7% |
| Immigrants | Belize | 9.2 /100 | #223 | Tragic 64.7% |
| Immigrants | Jamaica | 8.8 /100 | #224 | Tragic 64.7% |
| Croatians | 8.8 /100 | #225 | Tragic 64.7% |
| Europeans | 8.3 /100 | #226 | Tragic 64.7% |
| Poles | 8.3 /100 | #227 | Tragic 64.7% |
| Northern Europeans | 8.2 /100 | #228 | Tragic 64.7% |
| British | 7.3 /100 | #229 | Tragic 64.7% |
| Chinese | 7.3 /100 | #230 | Tragic 64.7% |
| Immigrants | Northern Europe | 7.2 /100 | #231 | Tragic 64.7% |
| Africans | 5.8 /100 | #232 | Tragic 64.6% |
| Slavs | 4.9 /100 | #233 | Tragic 64.6% |
| Vietnamese | 4.7 /100 | #234 | Tragic 64.6% |
| Austrians | 4.6 /100 | #235 | Tragic 64.6% |
Demographics Similar to Bahamians by In Labor Force | Age > 16
In terms of in labor force | age > 16, the demographic groups most similar to Bahamians are Finnish (64.2%, a difference of 0.010%), Dutch (64.2%, a difference of 0.020%), Marshallese (64.2%, a difference of 0.030%), Basque (64.2%, a difference of 0.030%), and Immigrants from Western Europe (64.2%, a difference of 0.040%).
| Demographics | Rating | Rank | In Labor Force | Age > 16 |
| Immigrants | Mexico | 1.0 /100 | #256 | Tragic 64.3% |
| Inupiat | 0.8 /100 | #257 | Tragic 64.3% |
| Immigrants | Scotland | 0.8 /100 | #258 | Tragic 64.2% |
| Immigrants | Western Europe | 0.7 /100 | #259 | Tragic 64.2% |
| Marshallese | 0.7 /100 | #260 | Tragic 64.2% |
| Basques | 0.7 /100 | #261 | Tragic 64.2% |
| Finns | 0.7 /100 | #262 | Tragic 64.2% |
| Bahamians | 0.6 /100 | #263 | Tragic 64.2% |
| Dutch | 0.6 /100 | #264 | Tragic 64.2% |
| Cubans | 0.5 /100 | #265 | Tragic 64.2% |
| Immigrants | England | 0.5 /100 | #266 | Tragic 64.2% |
| Canadians | 0.5 /100 | #267 | Tragic 64.1% |
| Spaniards | 0.5 /100 | #268 | Tragic 64.1% |
| Irish | 0.4 /100 | #269 | Tragic 64.1% |
| Guyanese | 0.4 /100 | #270 | Tragic 64.1% |