Nicaraguan vs Immigrants from Guyana In Labor Force | Age 25-29
COMPARE
Nicaraguan
Immigrants from Guyana
In Labor Force | Age 25-29
In Labor Force | Age 25-29 Comparison
Nicaraguans
Immigrants from Guyana
83.1%
IN LABOR FORCE | AGE 25-29
0.0/ 100
METRIC RATING
284th/ 347
METRIC RANK
83.0%
IN LABOR FORCE | AGE 25-29
0.0/ 100
METRIC RATING
292nd/ 347
METRIC RANK
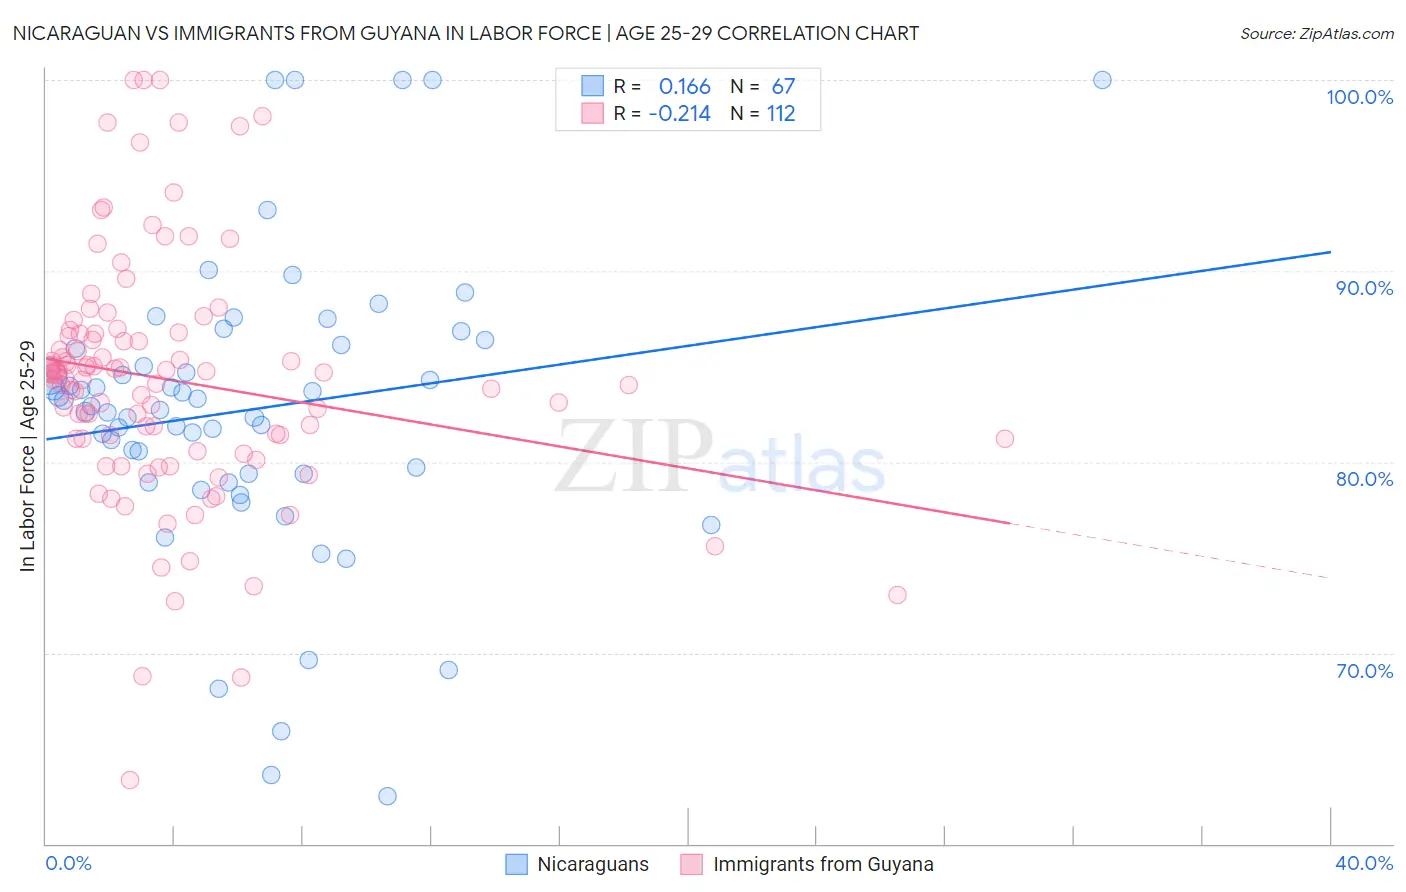
Nicaraguan vs Immigrants from Guyana In Labor Force | Age 25-29 Correlation Chart
The statistical analysis conducted on geographies consisting of 285,680,331 people shows a poor positive correlation between the proportion of Nicaraguans and labor force participation rate among population between the ages 25 and 29 in the United States with a correlation coefficient (R) of 0.166 and weighted average of 83.1%. Similarly, the statistical analysis conducted on geographies consisting of 183,703,762 people shows a weak negative correlation between the proportion of Immigrants from Guyana and labor force participation rate among population between the ages 25 and 29 in the United States with a correlation coefficient (R) of -0.214 and weighted average of 83.0%, a difference of 0.16%.
In Labor Force | Age 25-29 Correlation Summary
| Measurement | Nicaraguan | Immigrants from Guyana |
| Minimum | 62.5% | 63.4% |
| Maximum | 100.0% | 100.0% |
| Range | 37.5% | 36.6% |
| Mean | 82.7% | 84.3% |
| Median | 82.9% | 84.6% |
| Interquartile 25% (IQ1) | 79.4% | 81.2% |
| Interquartile 75% (IQ3) | 86.1% | 86.7% |
| Interquartile Range (IQR) | 6.7% | 5.5% |
| Standard Deviation (Sample) | 7.7% | 6.4% |
| Standard Deviation (Population) | 7.7% | 6.4% |
Demographics Similar to Nicaraguans and Immigrants from Guyana by In Labor Force | Age 25-29
In terms of in labor force | age 25-29, the demographic groups most similar to Nicaraguans are American (83.1%, a difference of 0.020%), Immigrants from the Azores (83.1%, a difference of 0.020%), Immigrants from Dominican Republic (83.1%, a difference of 0.030%), Belizean (83.1%, a difference of 0.030%), and Mexican American Indian (83.0%, a difference of 0.050%). Similarly, the demographic groups most similar to Immigrants from Guyana are Immigrants from Bangladesh (83.0%, a difference of 0.020%), Hawaiian (83.0%, a difference of 0.020%), Immigrants from Latin America (82.9%, a difference of 0.030%), Nepalese (82.9%, a difference of 0.040%), and Chippewa (82.9%, a difference of 0.040%).
| Demographics | Rating | Rank | In Labor Force | Age 25-29 |
| Immigrants | Cuba | 0.0 /100 | #278 | Tragic 83.2% |
| British West Indians | 0.0 /100 | #279 | Tragic 83.2% |
| Dominicans | 0.0 /100 | #280 | Tragic 83.2% |
| Immigrants | Dominican Republic | 0.0 /100 | #281 | Tragic 83.1% |
| Americans | 0.0 /100 | #282 | Tragic 83.1% |
| Immigrants | Azores | 0.0 /100 | #283 | Tragic 83.1% |
| Nicaraguans | 0.0 /100 | #284 | Tragic 83.1% |
| Belizeans | 0.0 /100 | #285 | Tragic 83.1% |
| Mexican American Indians | 0.0 /100 | #286 | Tragic 83.0% |
| Guyanese | 0.0 /100 | #287 | Tragic 83.0% |
| Ottawa | 0.0 /100 | #288 | Tragic 83.0% |
| Immigrants | Micronesia | 0.0 /100 | #289 | Tragic 83.0% |
| Immigrants | Bangladesh | 0.0 /100 | #290 | Tragic 83.0% |
| Hawaiians | 0.0 /100 | #291 | Tragic 83.0% |
| Immigrants | Guyana | 0.0 /100 | #292 | Tragic 83.0% |
| Immigrants | Latin America | 0.0 /100 | #293 | Tragic 82.9% |
| Nepalese | 0.0 /100 | #294 | Tragic 82.9% |
| Chippewa | 0.0 /100 | #295 | Tragic 82.9% |
| Immigrants | Nicaragua | 0.0 /100 | #296 | Tragic 82.9% |
| Potawatomi | 0.0 /100 | #297 | Tragic 82.9% |
| Native Hawaiians | 0.0 /100 | #298 | Tragic 82.9% |