Immigrants from Western Asia vs Immigrants from Guyana In Labor Force | Age 25-29
COMPARE
Immigrants from Western Asia
Immigrants from Guyana
In Labor Force | Age 25-29
In Labor Force | Age 25-29 Comparison
Immigrants from Western Asia
Immigrants from Guyana
84.1%
IN LABOR FORCE | AGE 25-29
2.7/ 100
METRIC RATING
233rd/ 347
METRIC RANK
83.0%
IN LABOR FORCE | AGE 25-29
0.0/ 100
METRIC RATING
292nd/ 347
METRIC RANK
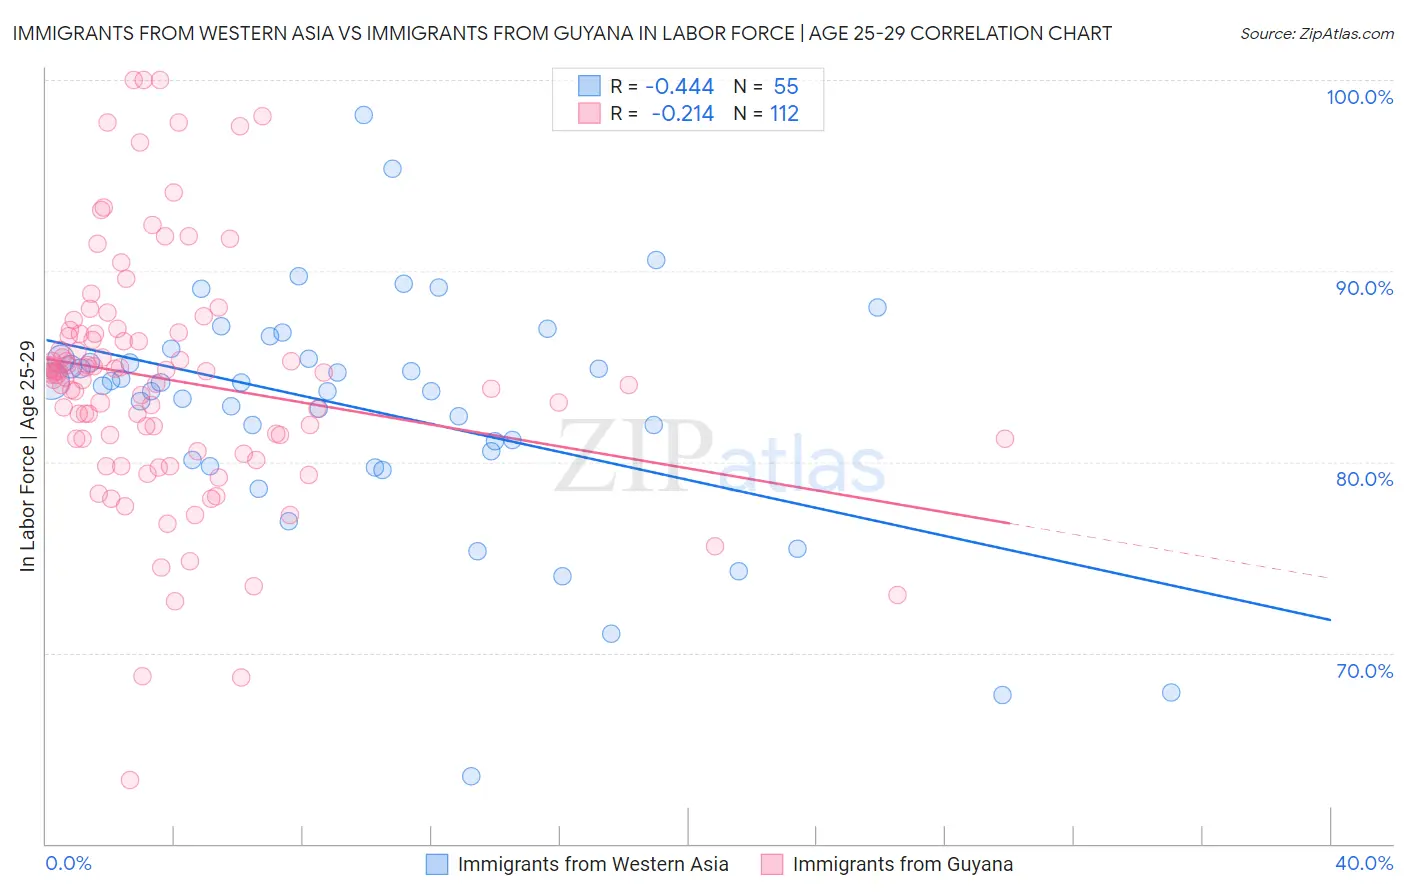
Immigrants from Western Asia vs Immigrants from Guyana In Labor Force | Age 25-29 Correlation Chart
The statistical analysis conducted on geographies consisting of 404,303,422 people shows a moderate negative correlation between the proportion of Immigrants from Western Asia and labor force participation rate among population between the ages 25 and 29 in the United States with a correlation coefficient (R) of -0.444 and weighted average of 84.1%. Similarly, the statistical analysis conducted on geographies consisting of 183,703,762 people shows a weak negative correlation between the proportion of Immigrants from Guyana and labor force participation rate among population between the ages 25 and 29 in the United States with a correlation coefficient (R) of -0.214 and weighted average of 83.0%, a difference of 1.4%.
In Labor Force | Age 25-29 Correlation Summary
| Measurement | Immigrants from Western Asia | Immigrants from Guyana |
| Minimum | 63.5% | 63.4% |
| Maximum | 98.1% | 100.0% |
| Range | 34.6% | 36.6% |
| Mean | 82.7% | 84.3% |
| Median | 84.0% | 84.6% |
| Interquartile 25% (IQ1) | 80.1% | 81.2% |
| Interquartile 75% (IQ3) | 85.4% | 86.7% |
| Interquartile Range (IQR) | 5.3% | 5.5% |
| Standard Deviation (Sample) | 6.2% | 6.4% |
| Standard Deviation (Population) | 6.2% | 6.4% |
Similar Demographics by In Labor Force | Age 25-29
Demographics Similar to Immigrants from Western Asia by In Labor Force | Age 25-29
In terms of in labor force | age 25-29, the demographic groups most similar to Immigrants from Western Asia are Panamanian (84.2%, a difference of 0.10%), White/Caucasian (84.2%, a difference of 0.11%), Immigrants from Philippines (84.2%, a difference of 0.11%), Immigrants from Oceania (84.2%, a difference of 0.12%), and French American Indian (84.2%, a difference of 0.14%).
| Demographics | Rating | Rank | In Labor Force | Age 25-29 |
| Immigrants | Congo | 5.8 /100 | #226 | Tragic 84.2% |
| French American Indians | 5.5 /100 | #227 | Tragic 84.2% |
| Immigrants | Panama | 5.5 /100 | #228 | Tragic 84.2% |
| Immigrants | Oceania | 5.0 /100 | #229 | Tragic 84.2% |
| Whites/Caucasians | 4.8 /100 | #230 | Tragic 84.2% |
| Immigrants | Philippines | 4.7 /100 | #231 | Tragic 84.2% |
| Panamanians | 4.5 /100 | #232 | Tragic 84.2% |
| Immigrants | Western Asia | 2.7 /100 | #233 | Tragic 84.1% |
| Barbadians | 1.0 /100 | #234 | Tragic 83.9% |
| Iraqis | 0.9 /100 | #235 | Tragic 83.9% |
| Guamanians/Chamorros | 0.9 /100 | #236 | Tragic 83.9% |
| Immigrants | Immigrants | 0.9 /100 | #237 | Tragic 83.9% |
| Immigrants | Uzbekistan | 0.8 /100 | #238 | Tragic 83.9% |
| Jamaicans | 0.8 /100 | #239 | Tragic 83.9% |
| Trinidadians and Tobagonians | 0.7 /100 | #240 | Tragic 83.9% |
Demographics Similar to Immigrants from Guyana by In Labor Force | Age 25-29
In terms of in labor force | age 25-29, the demographic groups most similar to Immigrants from Guyana are Immigrants from Bangladesh (83.0%, a difference of 0.020%), Hawaiian (83.0%, a difference of 0.020%), Immigrants from Latin America (82.9%, a difference of 0.030%), Nepalese (82.9%, a difference of 0.040%), and Chippewa (82.9%, a difference of 0.040%).
| Demographics | Rating | Rank | In Labor Force | Age 25-29 |
| Belizeans | 0.0 /100 | #285 | Tragic 83.1% |
| Mexican American Indians | 0.0 /100 | #286 | Tragic 83.0% |
| Guyanese | 0.0 /100 | #287 | Tragic 83.0% |
| Ottawa | 0.0 /100 | #288 | Tragic 83.0% |
| Immigrants | Micronesia | 0.0 /100 | #289 | Tragic 83.0% |
| Immigrants | Bangladesh | 0.0 /100 | #290 | Tragic 83.0% |
| Hawaiians | 0.0 /100 | #291 | Tragic 83.0% |
| Immigrants | Guyana | 0.0 /100 | #292 | Tragic 83.0% |
| Immigrants | Latin America | 0.0 /100 | #293 | Tragic 82.9% |
| Nepalese | 0.0 /100 | #294 | Tragic 82.9% |
| Chippewa | 0.0 /100 | #295 | Tragic 82.9% |
| Immigrants | Nicaragua | 0.0 /100 | #296 | Tragic 82.9% |
| Potawatomi | 0.0 /100 | #297 | Tragic 82.9% |
| Native Hawaiians | 0.0 /100 | #298 | Tragic 82.9% |
| Fijians | 0.0 /100 | #299 | Tragic 82.9% |