Arapaho vs Immigrants from Guyana In Labor Force | Age 25-29

COMPARE

Arapaho
Race
Ancestry
AfghanAfricanAlaska NativeAlaskan AthabascanAlbanianAleutAlsatianAmericanApacheArabArapahoArgentineanArmenianAssyrian/Chaldean/SyriacAustralianAustrianBahamianBangladeshiBarbadianBasqueBelgianBelizeanBermudanBhutaneseBlackfeetBolivianBrazilianBritishBritish West IndianBulgarianBurmeseCajunCambodianCanadianCape VerdeanCarpatho RusynCelticCentral AmericanCentral American IndianCherokeeCheyenneChickasawChileanChineseChippewaChoctawColombianColvilleComancheCosta RicanCreeCreekCroatianCrowCubanCypriotCzechCzechoslovakianDanishDelawareDominicanDutchDutch West IndianEastern EuropeanEcuadorianEgyptianEnglishEstonianEthiopianEuropeanFijianFilipinoFinnishFrenchFrench American IndianFrench CanadianGermanGerman RussianGhanaianGreekGuamanian/ChamorroGuatemalanGuyaneseHaitianHmongHonduranHopiHoumaHungarianIcelanderIndian (Asian)IndonesianInupiatIranianIraqiIrishIroquoisIsraeliItalianJamaicanJapaneseJordanianKenyanKiowaKoreanLaotianLatvianLebaneseLiberianLithuanianLumbeeLuxembourgerMacedonianMalaysianMalteseMarshalleseMenomineeMexicanMexican American IndianMongolianMoroccanNative HawaiianNavajoNepaleseNew ZealanderNicaraguanNigerianNorthern EuropeanNorwegianOkinawanOsageOttawaPaiutePakistaniPalestinianPanamanianParaguayanPennsylvania GermanPeruvianPimaPolishPortuguesePotawatomiPuebloPuerto RicanPuget Sound SalishRomanianRussianSalvadoranSamoanScandinavianScotch-IrishScottishSeminoleSenegaleseSerbianShoshoneSierra LeoneanSiouxSlavicSlovakSloveneSomaliSouth AfricanSouth AmericanSouth American IndianSoviet UnionSpaniardSpanishSpanish AmericanSpanish American IndianSri LankanSubsaharan AfricanSudaneseSwedishSwissSyrianTaiwaneseThaiTlingit-HaidaTohono O'OdhamTonganTrinidadian and TobagonianTsimshianTurkishU.S. Virgin IslanderUgandanUkrainianUruguayanUteVenezuelanVietnameseWelshWest IndianYakamaYaquiYugoslavianYumanYup'ikZimbabwean
Immigration
NonimmigrantsImmigrantsAfghanistanAfricaAlbaniaArgentinaArmeniaAsiaAustraliaAustriaBahamasBangladeshBarbadosBelarusBelgiumBelizeBoliviaBosnia and HerzegovinaBrazilBulgariaBurma/MyanmarCabo VerdeCambodiaCameroonCanadaCaribbeanCentral AmericaChileChinaColombiaCongoCosta RicaCroatiaCubaCzechoslovakiaDenmarkDominicaDominican RepublicEastern AfricaEastern AsiaEastern EuropeEcuadorEgyptEl SalvadorEnglandEritreaEthiopiaEuropeFijiFranceGermanyGhanaGreeceGrenadaGuatemalaHaitiHondurasHong KongHungaryIndiaIndonesiaIranIraqIrelandIsraelItalyJamaicaJapanJordanKazakhstanKenyaKoreaKuwaitLaosLatin AmericaLatviaLebanonLiberiaLithuaniaMalaysiaMexicoMicronesiaMiddle AfricaMoldovaMoroccoNepalNetherlandsNicaraguaNigeriaNorth AmericaNorth MacedoniaNorthern AfricaNorthern EuropeNorwayOceaniaPakistanPanamaPeruPhilippinesPolandPortugalRomaniaRussiaSaudi ArabiaScotlandSenegalSerbiaSierra LeoneSingaporeSomaliaSouth AfricaSouth AmericaSouth Central AsiaSouth Eastern AsiaSouthern EuropeSpainSri LankaSt. Vincent and the GrenadinesSudanSwedenSwitzerlandSyriaTaiwanThailandTrinidad and TobagoTurkeyUgandaUkraineUruguayUzbekistanVenezuelaVietnamWest IndiesWestern AfricaWestern AsiaWestern EuropeYemenZaireZimbabweAzores
Immigrants from Guyana
Race
Ancestry
AfghanAfricanAlaska NativeAlaskan AthabascanAlbanianAleutAlsatianAmericanApacheArabArgentineanArmenianAssyrian/Chaldean/SyriacAustralianAustrianBahamianBangladeshiBarbadianBasqueBelgianBelizeanBermudanBhutaneseBlackfeetBolivianBrazilianBritishBritish West IndianBulgarianBurmeseCajunCambodianCanadianCape VerdeanCarpatho RusynCelticCentral AmericanCentral American IndianCherokeeCheyenneChickasawChileanChineseChippewaChoctawColombianColvilleComancheCosta RicanCreeCreekCroatianCrowCubanCypriotCzechCzechoslovakianDanishDelawareDominicanDutchDutch West IndianEastern EuropeanEcuadorianEgyptianEnglishEstonianEthiopianEuropeanFijianFilipinoFinnishFrenchFrench American IndianFrench CanadianGermanGerman RussianGhanaianGreekGuamanian/ChamorroGuatemalanGuyaneseHaitianHmongHonduranHopiHoumaHungarianIcelanderIndian (Asian)IndonesianInupiatIranianIraqiIrishIroquoisIsraeliItalianJamaicanJapaneseJordanianKenyanKiowaKoreanLaotianLatvianLebaneseLiberianLithuanianLumbeeLuxembourgerMacedonianMalaysianMalteseMarshalleseMenomineeMexicanMexican American IndianMongolianMoroccanNative HawaiianNavajoNepaleseNew ZealanderNicaraguanNigerianNorthern EuropeanNorwegianOkinawanOsageOttawaPaiutePakistaniPalestinianPanamanianParaguayanPennsylvania GermanPeruvianPimaPolishPortuguesePotawatomiPuebloPuerto RicanPuget Sound SalishRomanianRussianSalvadoranSamoanScandinavianScotch-IrishScottishSeminoleSenegaleseSerbianShoshoneSierra LeoneanSiouxSlavicSlovakSloveneSomaliSouth AfricanSouth AmericanSouth American IndianSoviet UnionSpaniardSpanishSpanish AmericanSpanish American IndianSri LankanSubsaharan AfricanSudaneseSwedishSwissSyrianTaiwaneseThaiTlingit-HaidaTohono O'OdhamTonganTrinidadian and TobagonianTsimshianTurkishU.S. Virgin IslanderUgandanUkrainianUruguayanUteVenezuelanVietnameseWelshWest IndianYakamaYaquiYugoslavianYumanYup'ikZimbabwean
Immigration
NonimmigrantsImmigrantsAfghanistanAfricaAlbaniaArgentinaArmeniaAsiaAustraliaAustriaBahamasBangladeshBarbadosBelarusBelgiumBelizeBoliviaBosnia and HerzegovinaBrazilBulgariaBurma/MyanmarCabo VerdeCambodiaCameroonCanadaCaribbeanCentral AmericaChileChinaColombiaCongoCosta RicaCroatiaCubaCzechoslovakiaDenmarkDominicaDominican RepublicEastern AfricaEastern AsiaEastern EuropeEcuadorEgyptEl SalvadorEnglandEritreaEthiopiaEuropeFijiFranceGermanyGhanaGreeceGrenadaGuatemalaGuyanaHaitiHondurasHong KongHungaryIndiaIndonesiaIranIraqIrelandIsraelItalyJamaicaJapanJordanKazakhstanKenyaKoreaKuwaitLaosLatin AmericaLatviaLebanonLiberiaLithuaniaMalaysiaMexicoMicronesiaMiddle AfricaMoldovaMoroccoNepalNetherlandsNicaraguaNigeriaNorth AmericaNorth MacedoniaNorthern AfricaNorthern EuropeNorwayOceaniaPakistanPanamaPeruPhilippinesPolandPortugalRomaniaRussiaSaudi ArabiaScotlandSenegalSerbiaSierra LeoneSingaporeSomaliaSouth AfricaSouth AmericaSouth Central AsiaSouth Eastern AsiaSouthern EuropeSpainSri LankaSt. Vincent and the GrenadinesSudanSwedenSwitzerlandSyriaTaiwanThailandTrinidad and TobagoTurkeyUgandaUkraineUruguayUzbekistanVenezuelaVietnamWest IndiesWestern AfricaWestern AsiaWestern EuropeYemenZaireZimbabweAzores
In Labor Force | Age 25-29
Income
Poverty
Unemployment
Labor Participation
Family Structure
Vehicle Availability
Education Level
Disability

In Labor Force | Age 25-29 Comparison

Arapaho

Immigrants from Guyana

Tragic
Tragic
76.6%
IN LABOR FORCE | AGE 25-29
0.0/ 100
METRIC RATING
343rd/ 347
METRIC RANK
83.0%
IN LABOR FORCE | AGE 25-29
0.0/ 100
METRIC RATING
292nd/ 347
METRIC RANK

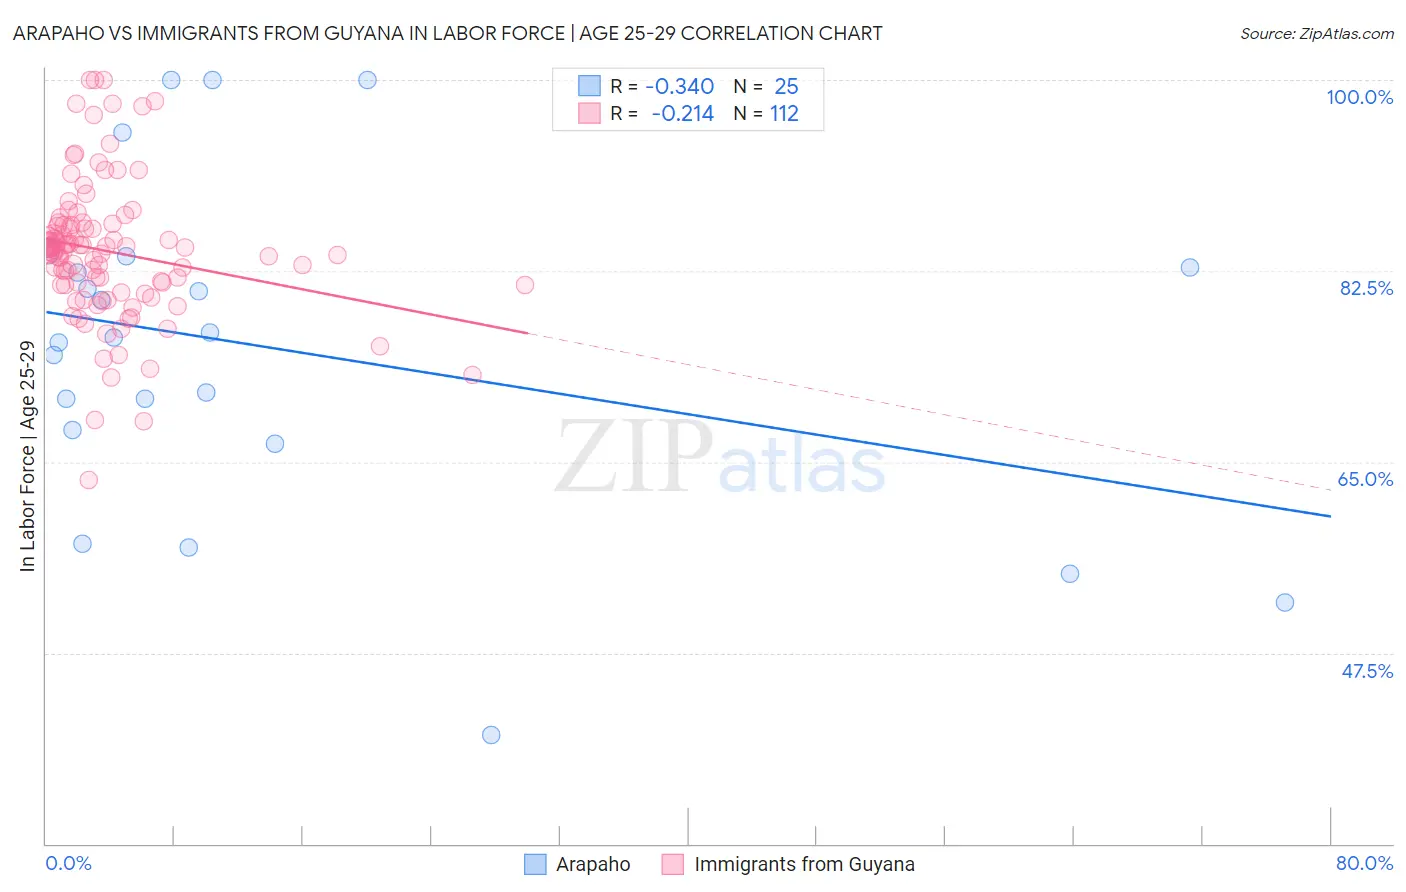
Arapaho vs Immigrants from Guyana In Labor Force | Age 25-29 Correlation Chart

The statistical analysis conducted on geographies consisting of 29,773,851 people shows a mild negative correlation between the proportion of Arapaho and labor force participation rate among population between the ages 25 and 29 in the United States with a correlation coefficient (R) of -0.340 and weighted average of 76.6%. Similarly, the statistical analysis conducted on geographies consisting of 183,703,762 people shows a weak negative correlation between the proportion of Immigrants from Guyana and labor force participation rate among population between the ages 25 and 29 in the United States with a correlation coefficient (R) of -0.214 and weighted average of 83.0%, a difference of 8.3%.
Arapaho vs Immigrants from Guyana In Labor Force | Age 25-29

In Labor Force | Age 25-29 Correlation Summary

MeasurementArapahoImmigrants from Guyana
Minimum40.0%63.4%
Maximum100.0%100.0%
Range60.0%36.6%
Mean75.3%84.3%
Median76.4%84.6%
Interquartile 25% (IQ1)67.3%81.2%
Interquartile 75% (IQ3)83.3%86.7%
Interquartile Range (IQR)16.0%5.5%
Standard Deviation (Sample)15.3%6.4%
Standard Deviation (Population)15.0%6.4%

Similar Demographics by In Labor Force | Age 25-29

Demographics Similar to Arapaho by In Labor Force | Age 25-29

In terms of in labor force | age 25-29, the demographic groups most similar to Arapaho are Hopi (76.5%, a difference of 0.060%), Pueblo (77.5%, a difference of 1.2%), Tohono O'odham (77.5%, a difference of 1.2%), Paiute (78.1%, a difference of 2.0%), and Immigrants from Yemen (78.2%, a difference of 2.2%).
DemographicsRating | RankIn Labor Force | Age 25-29
Sioux
0.0
/100
|
#333
Tragic
79.7%
Yuman
0.0
/100
|
#334
Tragic
79.3%
Natives/Alaskans
0.0
/100
|
#335
Tragic
79.3%
Apache
0.0
/100
|
#336
Tragic
79.2%
Crow
0.0
/100
|
#337
Tragic
78.6%
Lumbee
0.0
/100
|
#338
Tragic
78.3%
Immigrants | Yemen
0.0
/100
|
#339
Tragic
78.2%
Paiute
0.0
/100
|
#340
Tragic
78.1%
Tohono O'odham
0.0
/100
|
#341
Tragic
77.5%
Pueblo
0.0
/100
|
#342
Tragic
77.5%
Arapaho
0.0
/100
|
#343
Tragic
76.6%
Hopi
0.0
/100
|
#344
Tragic
76.5%
Navajo
0.0
/100
|
#345
Tragic
74.6%
Pima
0.0
/100
|
#346
Tragic
74.3%
Yup'ik
0.0
/100
|
#347
Tragic
73.1%

Demographics Similar to Immigrants from Guyana by In Labor Force | Age 25-29

In terms of in labor force | age 25-29, the demographic groups most similar to Immigrants from Guyana are Immigrants from Bangladesh (83.0%, a difference of 0.020%), Hawaiian (83.0%, a difference of 0.020%), Immigrants from Latin America (82.9%, a difference of 0.030%), Nepalese (82.9%, a difference of 0.040%), and Chippewa (82.9%, a difference of 0.040%).
DemographicsRating | RankIn Labor Force | Age 25-29
Belizeans
0.0
/100
|
#285
Tragic
83.1%
Mexican American Indians
0.0
/100
|
#286
Tragic
83.0%
Guyanese
0.0
/100
|
#287
Tragic
83.0%
Ottawa
0.0
/100
|
#288
Tragic
83.0%
Immigrants | Micronesia
0.0
/100
|
#289
Tragic
83.0%
Immigrants | Bangladesh
0.0
/100
|
#290
Tragic
83.0%
Hawaiians
0.0
/100
|
#291
Tragic
83.0%
Immigrants | Guyana
0.0
/100
|
#292
Tragic
83.0%
Immigrants | Latin America
0.0
/100
|
#293
Tragic
82.9%
Nepalese
0.0
/100
|
#294
Tragic
82.9%
Chippewa
0.0
/100
|
#295
Tragic
82.9%
Immigrants | Nicaragua
0.0
/100
|
#296
Tragic
82.9%
Potawatomi
0.0
/100
|
#297
Tragic
82.9%
Native Hawaiians
0.0
/100
|
#298
Tragic
82.9%
Fijians
0.0
/100
|
#299
Tragic
82.9%