Nicaraguan vs Immigrants from Guyana Median Family Income
COMPARE
Nicaraguan
Immigrants from Guyana
Median Family Income
Median Family Income Comparison
Nicaraguans
Immigrants from Guyana
$92,231
MEDIAN FAMILY INCOME
0.5/ 100
METRIC RATING
256th/ 347
METRIC RANK
$92,513
MEDIAN FAMILY INCOME
0.6/ 100
METRIC RATING
253rd/ 347
METRIC RANK
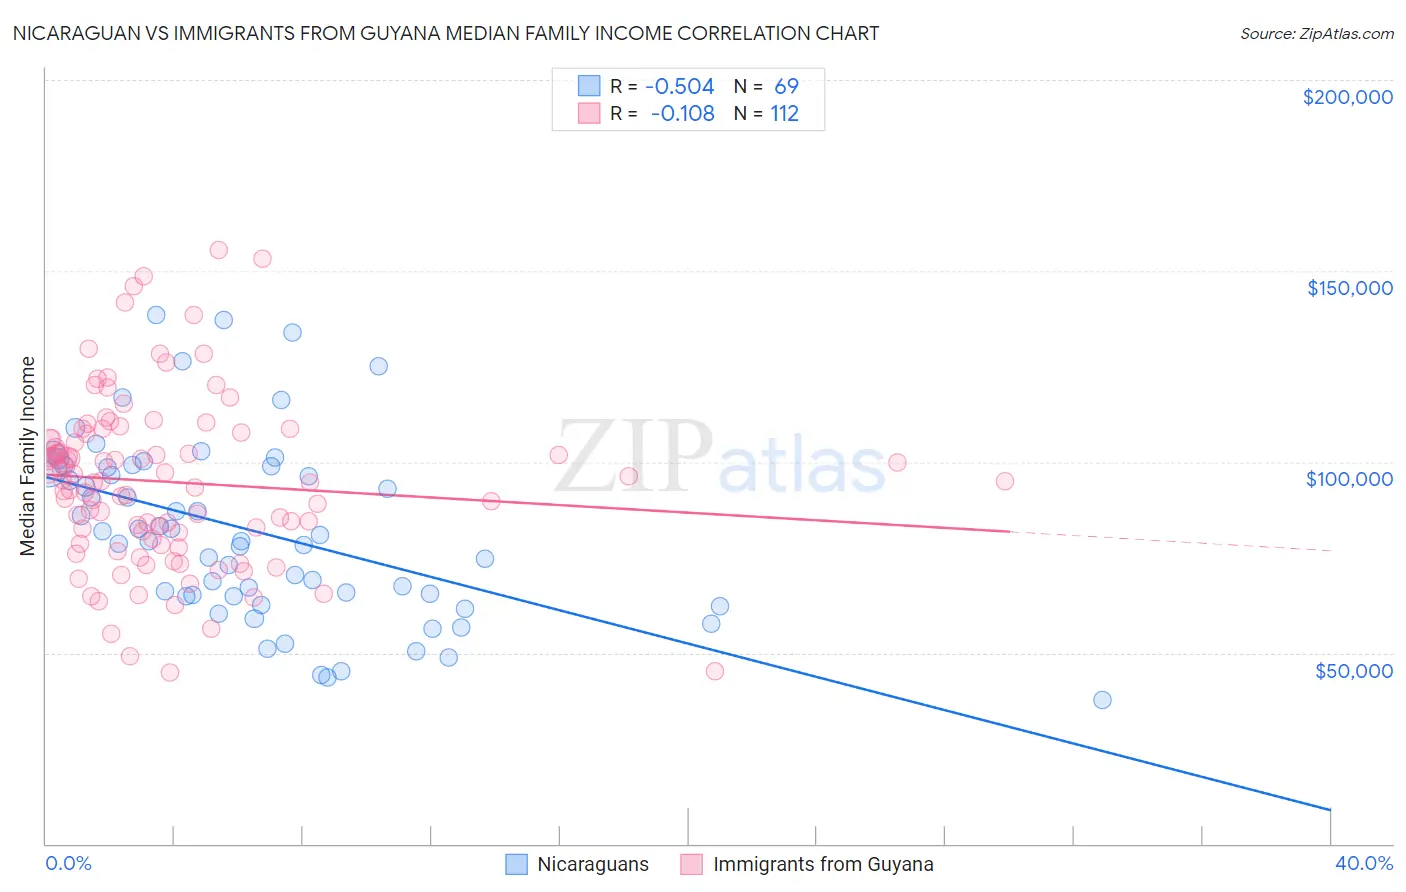
Nicaraguan vs Immigrants from Guyana Median Family Income Correlation Chart
The statistical analysis conducted on geographies consisting of 285,560,176 people shows a substantial negative correlation between the proportion of Nicaraguans and median family income in the United States with a correlation coefficient (R) of -0.504 and weighted average of $92,231. Similarly, the statistical analysis conducted on geographies consisting of 183,650,317 people shows a poor negative correlation between the proportion of Immigrants from Guyana and median family income in the United States with a correlation coefficient (R) of -0.108 and weighted average of $92,513, a difference of 0.31%.
Median Family Income Correlation Summary
| Measurement | Nicaraguan | Immigrants from Guyana |
| Minimum | $37,806 | $44,715 |
| Maximum | $138,531 | $155,346 |
| Range | $100,725 | $110,631 |
| Mean | $81,690 | $94,705 |
| Median | $79,377 | $94,807 |
| Interquartile 25% (IQ1) | $64,820 | $80,722 |
| Interquartile 75% (IQ3) | $98,783 | $106,748 |
| Interquartile Range (IQR) | $33,963 | $26,026 |
| Standard Deviation (Sample) | $23,577 | $22,061 |
| Standard Deviation (Population) | $23,406 | $21,962 |
Demographics Similar to Nicaraguans and Immigrants from Guyana by Median Family Income
In terms of median family income, the demographic groups most similar to Nicaraguans are Immigrants from Laos ($92,239, a difference of 0.010%), American ($92,096, a difference of 0.15%), Immigrants from Barbados ($92,419, a difference of 0.20%), Osage ($91,926, a difference of 0.33%), and Immigrants from El Salvador ($92,545, a difference of 0.34%). Similarly, the demographic groups most similar to Immigrants from Guyana are Immigrants from El Salvador ($92,545, a difference of 0.030%), Immigrants from Somalia ($92,609, a difference of 0.10%), Immigrants from Barbados ($92,419, a difference of 0.10%), West Indian ($92,765, a difference of 0.27%), and Immigrants from Laos ($92,239, a difference of 0.30%).
| Demographics | Rating | Rank | Median Family Income |
| Sub-Saharan Africans | 1.0 /100 | #244 | Tragic $93,748 |
| Immigrants | Middle Africa | 1.0 /100 | #245 | Tragic $93,593 |
| Guyanese | 0.9 /100 | #246 | Tragic $93,373 |
| Immigrants | Senegal | 0.7 /100 | #247 | Tragic $92,912 |
| French American Indians | 0.7 /100 | #248 | Tragic $92,872 |
| Immigrants | Ecuador | 0.7 /100 | #249 | Tragic $92,837 |
| West Indians | 0.6 /100 | #250 | Tragic $92,765 |
| Immigrants | Somalia | 0.6 /100 | #251 | Tragic $92,609 |
| Immigrants | El Salvador | 0.6 /100 | #252 | Tragic $92,545 |
| Immigrants | Guyana | 0.6 /100 | #253 | Tragic $92,513 |
| Immigrants | Barbados | 0.5 /100 | #254 | Tragic $92,419 |
| Immigrants | Laos | 0.5 /100 | #255 | Tragic $92,239 |
| Nicaraguans | 0.5 /100 | #256 | Tragic $92,231 |
| Americans | 0.4 /100 | #257 | Tragic $92,096 |
| Osage | 0.4 /100 | #258 | Tragic $91,926 |
| Cape Verdeans | 0.4 /100 | #259 | Tragic $91,848 |
| Pennsylvania Germans | 0.4 /100 | #260 | Tragic $91,763 |
| Inupiat | 0.4 /100 | #261 | Tragic $91,730 |
| Liberians | 0.4 /100 | #262 | Tragic $91,722 |
| Immigrants | West Indies | 0.3 /100 | #263 | Tragic $91,588 |
| Senegalese | 0.3 /100 | #264 | Tragic $91,475 |