Ukrainian vs Immigrants from Guyana In Labor Force | Age 25-29
COMPARE
Ukrainian
Immigrants from Guyana
In Labor Force | Age 25-29
In Labor Force | Age 25-29 Comparison
Ukrainians
Immigrants from Guyana
85.2%
IN LABOR FORCE | AGE 25-29
96.7/ 100
METRIC RATING
86th/ 347
METRIC RANK
83.0%
IN LABOR FORCE | AGE 25-29
0.0/ 100
METRIC RATING
292nd/ 347
METRIC RANK
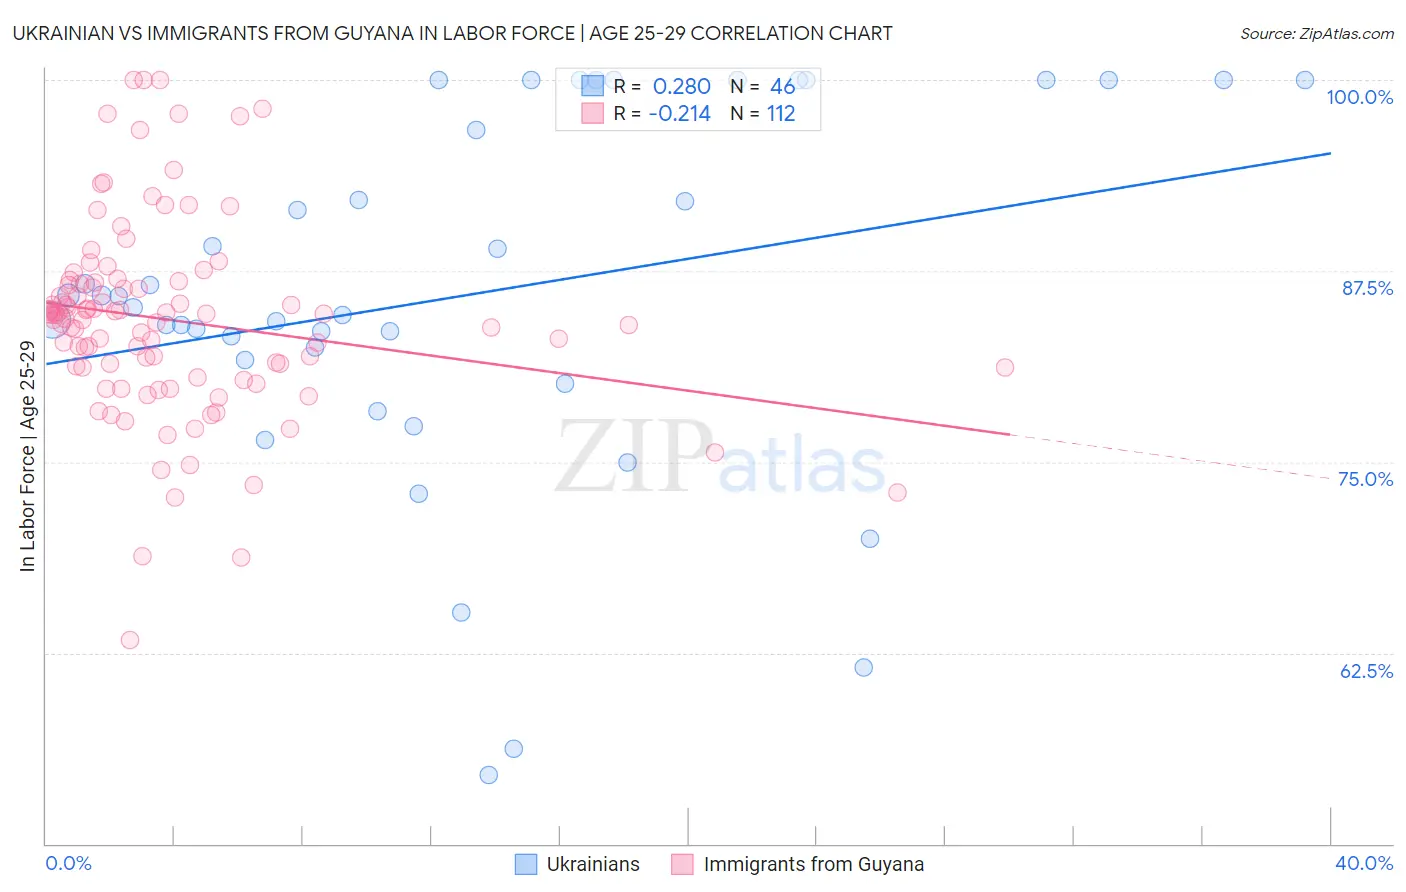
Ukrainian vs Immigrants from Guyana In Labor Force | Age 25-29 Correlation Chart
The statistical analysis conducted on geographies consisting of 448,388,747 people shows a weak positive correlation between the proportion of Ukrainians and labor force participation rate among population between the ages 25 and 29 in the United States with a correlation coefficient (R) of 0.280 and weighted average of 85.2%. Similarly, the statistical analysis conducted on geographies consisting of 183,703,762 people shows a weak negative correlation between the proportion of Immigrants from Guyana and labor force participation rate among population between the ages 25 and 29 in the United States with a correlation coefficient (R) of -0.214 and weighted average of 83.0%, a difference of 2.7%.
In Labor Force | Age 25-29 Correlation Summary
| Measurement | Ukrainian | Immigrants from Guyana |
| Minimum | 54.5% | 63.4% |
| Maximum | 100.0% | 100.0% |
| Range | 45.5% | 36.6% |
| Mean | 85.9% | 84.3% |
| Median | 85.5% | 84.6% |
| Interquartile 25% (IQ1) | 81.7% | 81.2% |
| Interquartile 75% (IQ3) | 100.0% | 86.7% |
| Interquartile Range (IQR) | 18.3% | 5.5% |
| Standard Deviation (Sample) | 11.9% | 6.4% |
| Standard Deviation (Population) | 11.8% | 6.4% |
Similar Demographics by In Labor Force | Age 25-29
Demographics Similar to Ukrainians by In Labor Force | Age 25-29
In terms of in labor force | age 25-29, the demographic groups most similar to Ukrainians are Immigrants from Africa (85.2%, a difference of 0.0%), Immigrants from Europe (85.2%, a difference of 0.010%), Immigrants from Eastern Europe (85.2%, a difference of 0.010%), French Canadian (85.2%, a difference of 0.010%), and Immigrants from Croatia (85.2%, a difference of 0.010%).
| Demographics | Rating | Rank | In Labor Force | Age 25-29 |
| Immigrants | Northern Africa | 97.6 /100 | #79 | Exceptional 85.2% |
| Immigrants | Zimbabwe | 97.6 /100 | #80 | Exceptional 85.2% |
| Immigrants | Northern Europe | 97.2 /100 | #81 | Exceptional 85.2% |
| Okinawans | 97.0 /100 | #82 | Exceptional 85.2% |
| Immigrants | Europe | 96.8 /100 | #83 | Exceptional 85.2% |
| Immigrants | Eastern Europe | 96.8 /100 | #84 | Exceptional 85.2% |
| Immigrants | Africa | 96.7 /100 | #85 | Exceptional 85.2% |
| Ukrainians | 96.7 /100 | #86 | Exceptional 85.2% |
| French Canadians | 96.5 /100 | #87 | Exceptional 85.2% |
| Immigrants | Croatia | 96.4 /100 | #88 | Exceptional 85.2% |
| Immigrants | France | 96.3 /100 | #89 | Exceptional 85.2% |
| Burmese | 95.9 /100 | #90 | Exceptional 85.1% |
| Immigrants | Moldova | 95.8 /100 | #91 | Exceptional 85.1% |
| Immigrants | Costa Rica | 95.5 /100 | #92 | Exceptional 85.1% |
| Austrians | 95.3 /100 | #93 | Exceptional 85.1% |
Demographics Similar to Immigrants from Guyana by In Labor Force | Age 25-29
In terms of in labor force | age 25-29, the demographic groups most similar to Immigrants from Guyana are Immigrants from Bangladesh (83.0%, a difference of 0.020%), Hawaiian (83.0%, a difference of 0.020%), Immigrants from Latin America (82.9%, a difference of 0.030%), Nepalese (82.9%, a difference of 0.040%), and Chippewa (82.9%, a difference of 0.040%).
| Demographics | Rating | Rank | In Labor Force | Age 25-29 |
| Belizeans | 0.0 /100 | #285 | Tragic 83.1% |
| Mexican American Indians | 0.0 /100 | #286 | Tragic 83.0% |
| Guyanese | 0.0 /100 | #287 | Tragic 83.0% |
| Ottawa | 0.0 /100 | #288 | Tragic 83.0% |
| Immigrants | Micronesia | 0.0 /100 | #289 | Tragic 83.0% |
| Immigrants | Bangladesh | 0.0 /100 | #290 | Tragic 83.0% |
| Hawaiians | 0.0 /100 | #291 | Tragic 83.0% |
| Immigrants | Guyana | 0.0 /100 | #292 | Tragic 83.0% |
| Immigrants | Latin America | 0.0 /100 | #293 | Tragic 82.9% |
| Nepalese | 0.0 /100 | #294 | Tragic 82.9% |
| Chippewa | 0.0 /100 | #295 | Tragic 82.9% |
| Immigrants | Nicaragua | 0.0 /100 | #296 | Tragic 82.9% |
| Potawatomi | 0.0 /100 | #297 | Tragic 82.9% |
| Native Hawaiians | 0.0 /100 | #298 | Tragic 82.9% |
| Fijians | 0.0 /100 | #299 | Tragic 82.9% |