Nicaraguan vs Immigrants from Guyana Unemployment Among Women with Children Under 6 years
COMPARE
Nicaraguan
Immigrants from Guyana
Unemployment Among Women with Children Under 6 years
Unemployment Among Women with Children Under 6 years Comparison
Nicaraguans
Immigrants from Guyana
7.2%
UNEMPLOYMENT AMONG WOMEN WITH CHILDREN UNDER 6 YEARS
96.3/ 100
METRIC RATING
113th/ 347
METRIC RANK
8.2%
UNEMPLOYMENT AMONG WOMEN WITH CHILDREN UNDER 6 YEARS
0.8/ 100
METRIC RATING
253rd/ 347
METRIC RANK
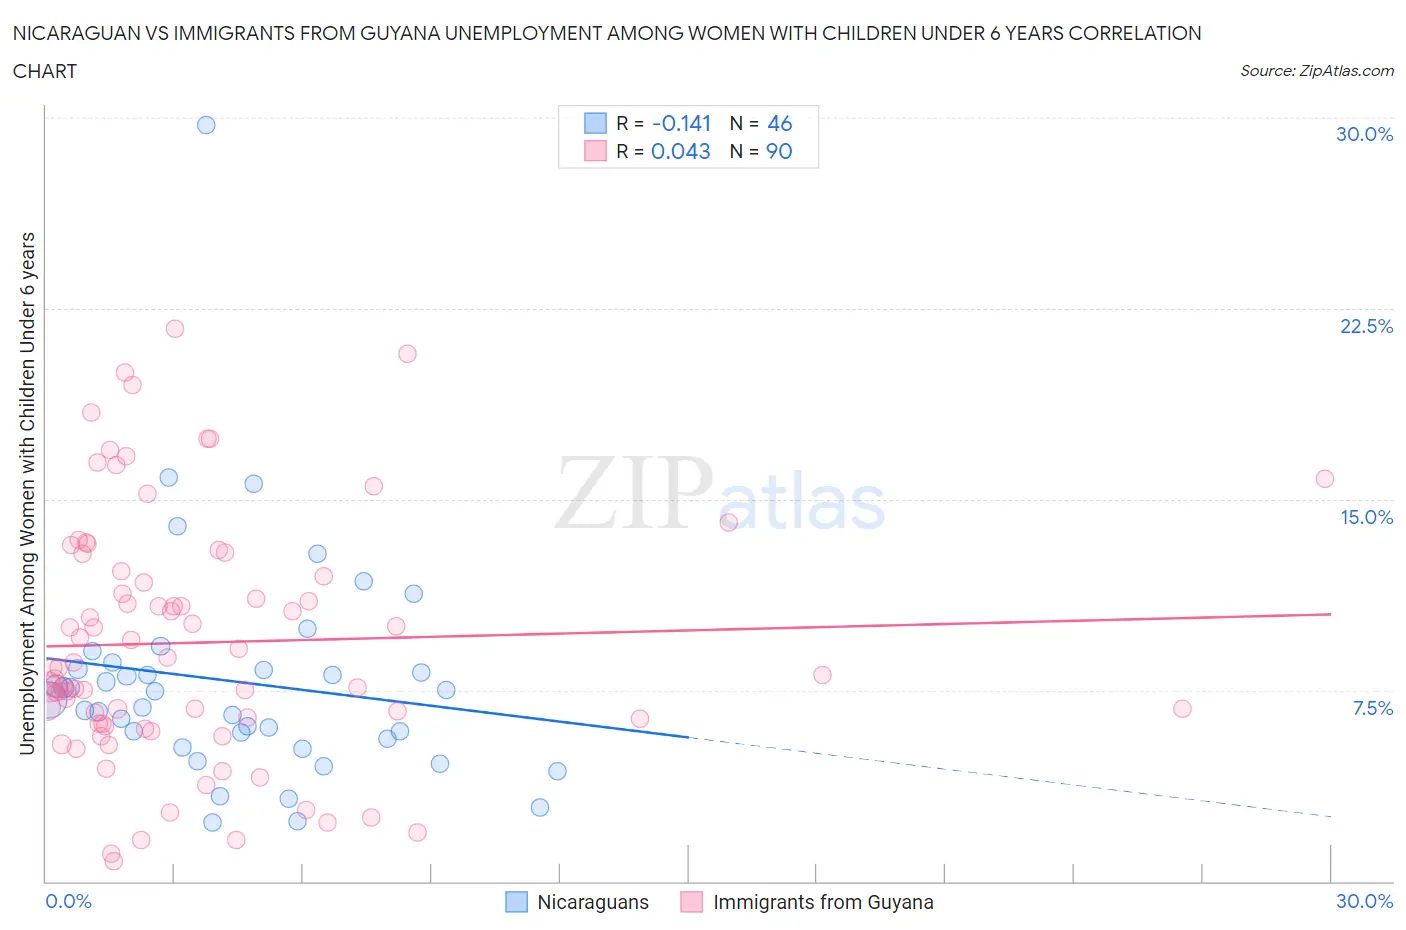
Nicaraguan vs Immigrants from Guyana Unemployment Among Women with Children Under 6 years Correlation Chart
The statistical analysis conducted on geographies consisting of 237,189,098 people shows a poor negative correlation between the proportion of Nicaraguans and unemployment rate among women with children under the age of 6 in the United States with a correlation coefficient (R) of -0.141 and weighted average of 7.2%. Similarly, the statistical analysis conducted on geographies consisting of 155,055,932 people shows no correlation between the proportion of Immigrants from Guyana and unemployment rate among women with children under the age of 6 in the United States with a correlation coefficient (R) of 0.043 and weighted average of 8.2%, a difference of 14.1%.
Unemployment Among Women with Children Under 6 years Correlation Summary
| Measurement | Nicaraguan | Immigrants from Guyana |
| Minimum | 2.3% | 0.77% |
| Maximum | 29.7% | 21.7% |
| Range | 27.4% | 20.9% |
| Mean | 7.8% | 9.4% |
| Median | 7.3% | 8.4% |
| Interquartile 25% (IQ1) | 5.6% | 6.2% |
| Interquartile 75% (IQ3) | 8.3% | 12.2% |
| Interquartile Range (IQR) | 2.7% | 6.0% |
| Standard Deviation (Sample) | 4.5% | 4.8% |
| Standard Deviation (Population) | 4.5% | 4.8% |
Similar Demographics by Unemployment Among Women with Children Under 6 years
Demographics Similar to Nicaraguans by Unemployment Among Women with Children Under 6 years
In terms of unemployment among women with children under 6 years, the demographic groups most similar to Nicaraguans are Argentinean (7.2%, a difference of 0.040%), Israeli (7.2%, a difference of 0.080%), Immigrants from Italy (7.2%, a difference of 0.12%), Norwegian (7.2%, a difference of 0.19%), and Armenian (7.2%, a difference of 0.22%).
| Demographics | Rating | Rank | Unemployment Among Women with Children Under 6 years |
| Immigrants | Pakistan | 97.2 /100 | #106 | Exceptional 7.2% |
| Immigrants | Kazakhstan | 97.1 /100 | #107 | Exceptional 7.2% |
| Eastern Europeans | 96.9 /100 | #108 | Exceptional 7.2% |
| Australians | 96.9 /100 | #109 | Exceptional 7.2% |
| Palestinians | 96.8 /100 | #110 | Exceptional 7.2% |
| Norwegians | 96.7 /100 | #111 | Exceptional 7.2% |
| Israelis | 96.5 /100 | #112 | Exceptional 7.2% |
| Nicaraguans | 96.3 /100 | #113 | Exceptional 7.2% |
| Argentineans | 96.2 /100 | #114 | Exceptional 7.2% |
| Immigrants | Italy | 96.1 /100 | #115 | Exceptional 7.2% |
| Armenians | 95.9 /100 | #116 | Exceptional 7.2% |
| Immigrants | Kenya | 95.4 /100 | #117 | Exceptional 7.3% |
| Serbians | 94.5 /100 | #118 | Exceptional 7.3% |
| South Africans | 94.1 /100 | #119 | Exceptional 7.3% |
| Iraqis | 93.9 /100 | #120 | Exceptional 7.3% |
Demographics Similar to Immigrants from Guyana by Unemployment Among Women with Children Under 6 years
In terms of unemployment among women with children under 6 years, the demographic groups most similar to Immigrants from Guyana are Guyanese (8.2%, a difference of 0.18%), Ghanaian (8.2%, a difference of 0.18%), Immigrants from Caribbean (8.3%, a difference of 0.27%), Nigerian (8.2%, a difference of 0.35%), and Immigrants from Sierra Leone (8.2%, a difference of 0.36%).
| Demographics | Rating | Rank | Unemployment Among Women with Children Under 6 years |
| Central Americans | 1.4 /100 | #246 | Tragic 8.2% |
| German Russians | 1.2 /100 | #247 | Tragic 8.2% |
| Immigrants | Western Africa | 1.1 /100 | #248 | Tragic 8.2% |
| Immigrants | Sierra Leone | 1.1 /100 | #249 | Tragic 8.2% |
| Nigerians | 1.1 /100 | #250 | Tragic 8.2% |
| Guyanese | 1.0 /100 | #251 | Tragic 8.2% |
| Ghanaians | 1.0 /100 | #252 | Tragic 8.2% |
| Immigrants | Guyana | 0.8 /100 | #253 | Tragic 8.2% |
| Immigrants | Caribbean | 0.7 /100 | #254 | Tragic 8.3% |
| Immigrants | Portugal | 0.6 /100 | #255 | Tragic 8.3% |
| Celtics | 0.6 /100 | #256 | Tragic 8.3% |
| British West Indians | 0.5 /100 | #257 | Tragic 8.3% |
| Immigrants | Ghana | 0.5 /100 | #258 | Tragic 8.3% |
| Barbadians | 0.4 /100 | #259 | Tragic 8.3% |
| Whites/Caucasians | 0.3 /100 | #260 | Tragic 8.4% |