Nicaraguan vs Scottish In Labor Force | Age 25-29
COMPARE
Nicaraguan
Scottish
In Labor Force | Age 25-29
In Labor Force | Age 25-29 Comparison
Nicaraguans
Scottish
83.1%
IN LABOR FORCE | AGE 25-29
0.0/ 100
METRIC RATING
284th/ 347
METRIC RANK
84.6%
IN LABOR FORCE | AGE 25-29
40.1/ 100
METRIC RATING
183rd/ 347
METRIC RANK
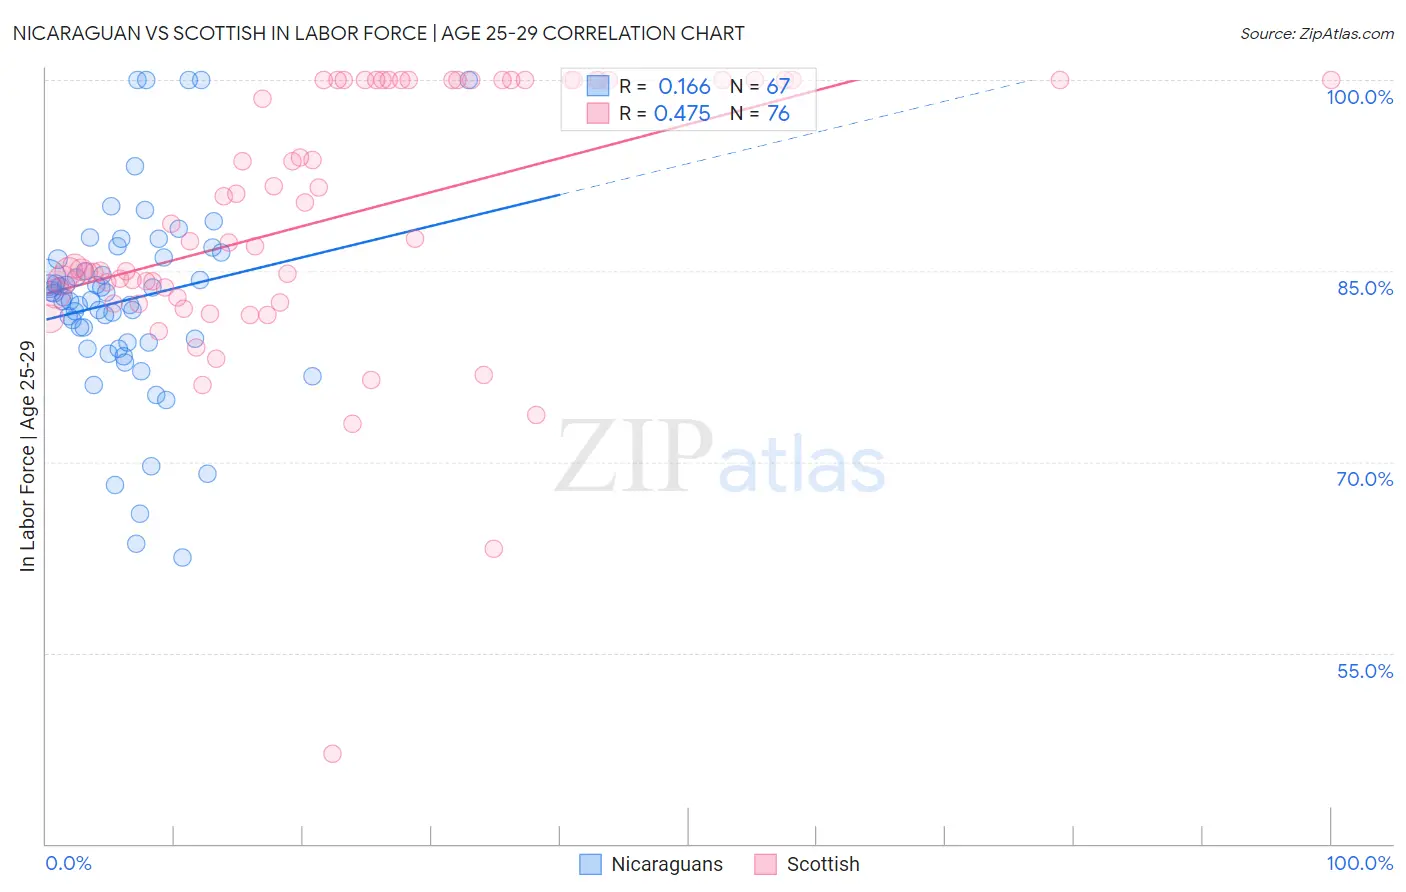
Nicaraguan vs Scottish In Labor Force | Age 25-29 Correlation Chart
The statistical analysis conducted on geographies consisting of 285,680,331 people shows a poor positive correlation between the proportion of Nicaraguans and labor force participation rate among population between the ages 25 and 29 in the United States with a correlation coefficient (R) of 0.166 and weighted average of 83.1%. Similarly, the statistical analysis conducted on geographies consisting of 565,804,130 people shows a moderate positive correlation between the proportion of Scottish and labor force participation rate among population between the ages 25 and 29 in the United States with a correlation coefficient (R) of 0.475 and weighted average of 84.6%, a difference of 1.8%.
In Labor Force | Age 25-29 Correlation Summary
| Measurement | Nicaraguan | Scottish |
| Minimum | 62.5% | 47.0% |
| Maximum | 100.0% | 100.0% |
| Range | 37.5% | 53.0% |
| Mean | 82.7% | 89.2% |
| Median | 82.9% | 87.4% |
| Interquartile 25% (IQ1) | 79.4% | 83.1% |
| Interquartile 75% (IQ3) | 86.1% | 100.0% |
| Interquartile Range (IQR) | 6.7% | 16.9% |
| Standard Deviation (Sample) | 7.7% | 10.2% |
| Standard Deviation (Population) | 7.7% | 10.1% |
Similar Demographics by In Labor Force | Age 25-29
Demographics Similar to Nicaraguans by In Labor Force | Age 25-29
In terms of in labor force | age 25-29, the demographic groups most similar to Nicaraguans are American (83.1%, a difference of 0.020%), Immigrants from the Azores (83.1%, a difference of 0.020%), Immigrants from Dominican Republic (83.1%, a difference of 0.030%), Belizean (83.1%, a difference of 0.030%), and Mexican American Indian (83.0%, a difference of 0.050%).
| Demographics | Rating | Rank | In Labor Force | Age 25-29 |
| Africans | 0.0 /100 | #277 | Tragic 83.2% |
| Immigrants | Cuba | 0.0 /100 | #278 | Tragic 83.2% |
| British West Indians | 0.0 /100 | #279 | Tragic 83.2% |
| Dominicans | 0.0 /100 | #280 | Tragic 83.2% |
| Immigrants | Dominican Republic | 0.0 /100 | #281 | Tragic 83.1% |
| Americans | 0.0 /100 | #282 | Tragic 83.1% |
| Immigrants | Azores | 0.0 /100 | #283 | Tragic 83.1% |
| Nicaraguans | 0.0 /100 | #284 | Tragic 83.1% |
| Belizeans | 0.0 /100 | #285 | Tragic 83.1% |
| Mexican American Indians | 0.0 /100 | #286 | Tragic 83.0% |
| Guyanese | 0.0 /100 | #287 | Tragic 83.0% |
| Ottawa | 0.0 /100 | #288 | Tragic 83.0% |
| Immigrants | Micronesia | 0.0 /100 | #289 | Tragic 83.0% |
| Immigrants | Bangladesh | 0.0 /100 | #290 | Tragic 83.0% |
| Hawaiians | 0.0 /100 | #291 | Tragic 83.0% |
Demographics Similar to Scottish by In Labor Force | Age 25-29
In terms of in labor force | age 25-29, the demographic groups most similar to Scottish are European (84.6%, a difference of 0.0%), Immigrants from Norway (84.6%, a difference of 0.010%), Immigrants from Kuwait (84.6%, a difference of 0.010%), Immigrants from South America (84.6%, a difference of 0.020%), and Immigrants from Denmark (84.6%, a difference of 0.020%).
| Demographics | Rating | Rank | In Labor Force | Age 25-29 |
| Malaysians | 46.8 /100 | #176 | Average 84.6% |
| Immigrants | China | 45.7 /100 | #177 | Average 84.6% |
| Immigrants | Thailand | 45.2 /100 | #178 | Average 84.6% |
| Immigrants | Argentina | 44.0 /100 | #179 | Average 84.6% |
| Immigrants | South America | 42.9 /100 | #180 | Average 84.6% |
| Immigrants | Norway | 41.9 /100 | #181 | Average 84.6% |
| Europeans | 40.3 /100 | #182 | Average 84.6% |
| Scottish | 40.1 /100 | #183 | Average 84.6% |
| Immigrants | Kuwait | 38.2 /100 | #184 | Fair 84.6% |
| Immigrants | Denmark | 37.0 /100 | #185 | Fair 84.6% |
| Immigrants | Belgium | 35.0 /100 | #186 | Fair 84.6% |
| Immigrants | Portugal | 34.7 /100 | #187 | Fair 84.6% |
| Immigrants | Ukraine | 33.7 /100 | #188 | Fair 84.5% |
| Moroccans | 32.6 /100 | #189 | Fair 84.5% |
| Welsh | 31.1 /100 | #190 | Fair 84.5% |