Ottawa vs Immigrants from Guyana In Labor Force | Age 25-29
COMPARE
Ottawa
Immigrants from Guyana
In Labor Force | Age 25-29
In Labor Force | Age 25-29 Comparison
Ottawa
Immigrants from Guyana
83.0%
IN LABOR FORCE | AGE 25-29
0.0/ 100
METRIC RATING
288th/ 347
METRIC RANK
83.0%
IN LABOR FORCE | AGE 25-29
0.0/ 100
METRIC RATING
292nd/ 347
METRIC RANK
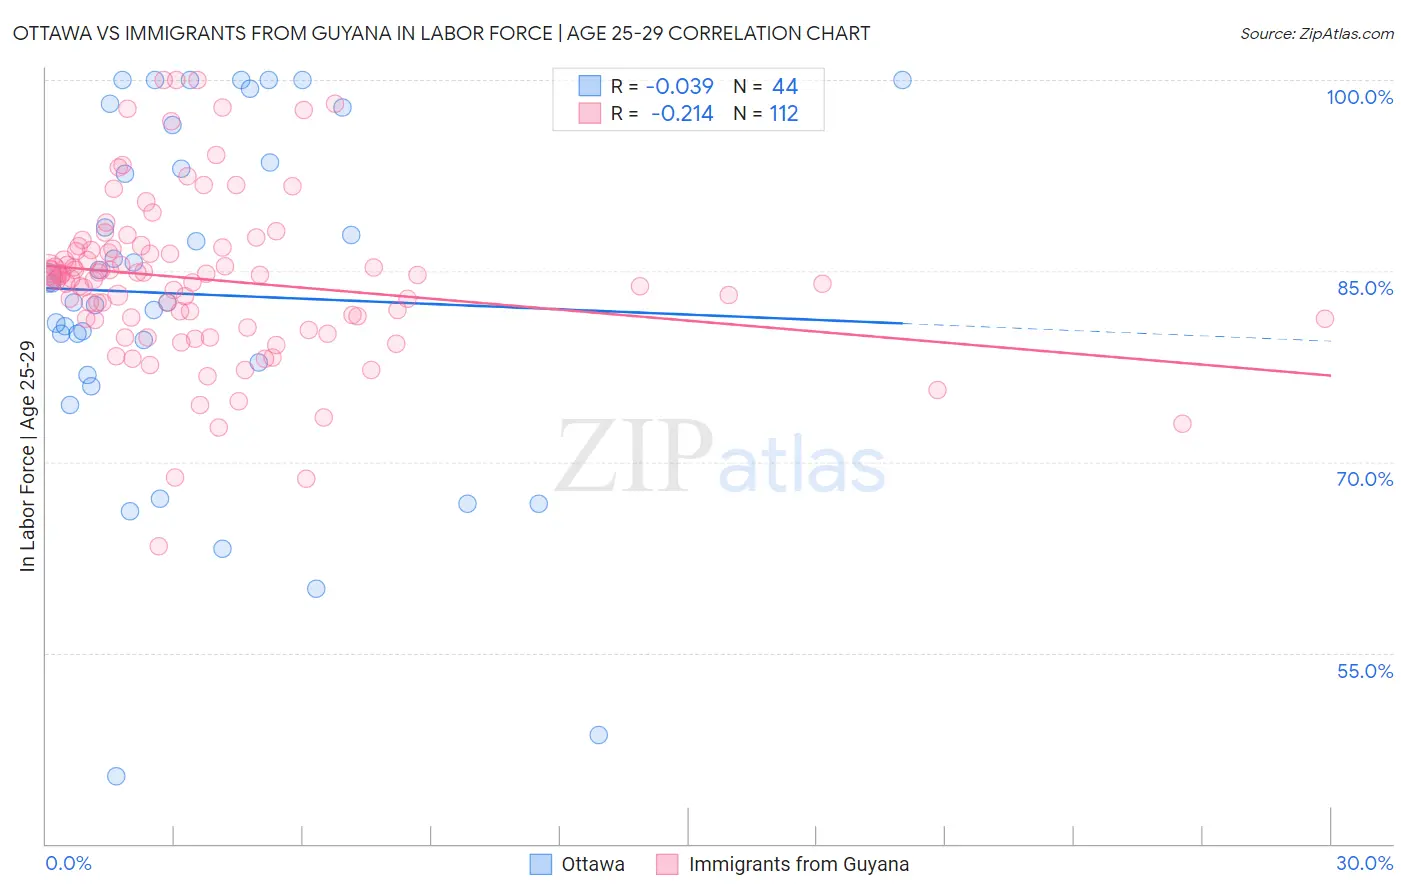
Ottawa vs Immigrants from Guyana In Labor Force | Age 25-29 Correlation Chart
The statistical analysis conducted on geographies consisting of 49,951,739 people shows no correlation between the proportion of Ottawa and labor force participation rate among population between the ages 25 and 29 in the United States with a correlation coefficient (R) of -0.039 and weighted average of 83.0%. Similarly, the statistical analysis conducted on geographies consisting of 183,703,762 people shows a weak negative correlation between the proportion of Immigrants from Guyana and labor force participation rate among population between the ages 25 and 29 in the United States with a correlation coefficient (R) of -0.214 and weighted average of 83.0%, a difference of 0.070%.
In Labor Force | Age 25-29 Correlation Summary
| Measurement | Ottawa | Immigrants from Guyana |
| Minimum | 45.3% | 63.4% |
| Maximum | 100.0% | 100.0% |
| Range | 54.7% | 36.6% |
| Mean | 83.2% | 84.3% |
| Median | 83.3% | 84.6% |
| Interquartile 25% (IQ1) | 77.3% | 81.2% |
| Interquartile 75% (IQ3) | 95.0% | 86.7% |
| Interquartile Range (IQR) | 17.7% | 5.5% |
| Standard Deviation (Sample) | 13.8% | 6.4% |
| Standard Deviation (Population) | 13.6% | 6.4% |
Demographics Similar to Ottawa and Immigrants from Guyana by In Labor Force | Age 25-29
In terms of in labor force | age 25-29, the demographic groups most similar to Ottawa are Immigrants from Micronesia (83.0%, a difference of 0.020%), Guyanese (83.0%, a difference of 0.030%), Mexican American Indian (83.0%, a difference of 0.040%), Immigrants from Bangladesh (83.0%, a difference of 0.050%), and Belizean (83.1%, a difference of 0.060%). Similarly, the demographic groups most similar to Immigrants from Guyana are Immigrants from Bangladesh (83.0%, a difference of 0.020%), Hawaiian (83.0%, a difference of 0.020%), Immigrants from Latin America (82.9%, a difference of 0.030%), Nepalese (82.9%, a difference of 0.040%), and Chippewa (82.9%, a difference of 0.040%).
| Demographics | Rating | Rank | In Labor Force | Age 25-29 |
| Dominicans | 0.0 /100 | #280 | Tragic 83.2% |
| Immigrants | Dominican Republic | 0.0 /100 | #281 | Tragic 83.1% |
| Americans | 0.0 /100 | #282 | Tragic 83.1% |
| Immigrants | Azores | 0.0 /100 | #283 | Tragic 83.1% |
| Nicaraguans | 0.0 /100 | #284 | Tragic 83.1% |
| Belizeans | 0.0 /100 | #285 | Tragic 83.1% |
| Mexican American Indians | 0.0 /100 | #286 | Tragic 83.0% |
| Guyanese | 0.0 /100 | #287 | Tragic 83.0% |
| Ottawa | 0.0 /100 | #288 | Tragic 83.0% |
| Immigrants | Micronesia | 0.0 /100 | #289 | Tragic 83.0% |
| Immigrants | Bangladesh | 0.0 /100 | #290 | Tragic 83.0% |
| Hawaiians | 0.0 /100 | #291 | Tragic 83.0% |
| Immigrants | Guyana | 0.0 /100 | #292 | Tragic 83.0% |
| Immigrants | Latin America | 0.0 /100 | #293 | Tragic 82.9% |
| Nepalese | 0.0 /100 | #294 | Tragic 82.9% |
| Chippewa | 0.0 /100 | #295 | Tragic 82.9% |
| Immigrants | Nicaragua | 0.0 /100 | #296 | Tragic 82.9% |
| Potawatomi | 0.0 /100 | #297 | Tragic 82.9% |
| Native Hawaiians | 0.0 /100 | #298 | Tragic 82.9% |
| Fijians | 0.0 /100 | #299 | Tragic 82.9% |
| Spanish American Indians | 0.0 /100 | #300 | Tragic 82.9% |