Nicaraguan vs Immigrants In Labor Force | Age 25-29
COMPARE
Nicaraguan
Immigrants
In Labor Force | Age 25-29
In Labor Force | Age 25-29 Comparison
Nicaraguans
Immigrants
83.1%
IN LABOR FORCE | AGE 25-29
0.0/ 100
METRIC RATING
284th/ 347
METRIC RANK
83.9%
IN LABOR FORCE | AGE 25-29
0.9/ 100
METRIC RATING
237th/ 347
METRIC RANK
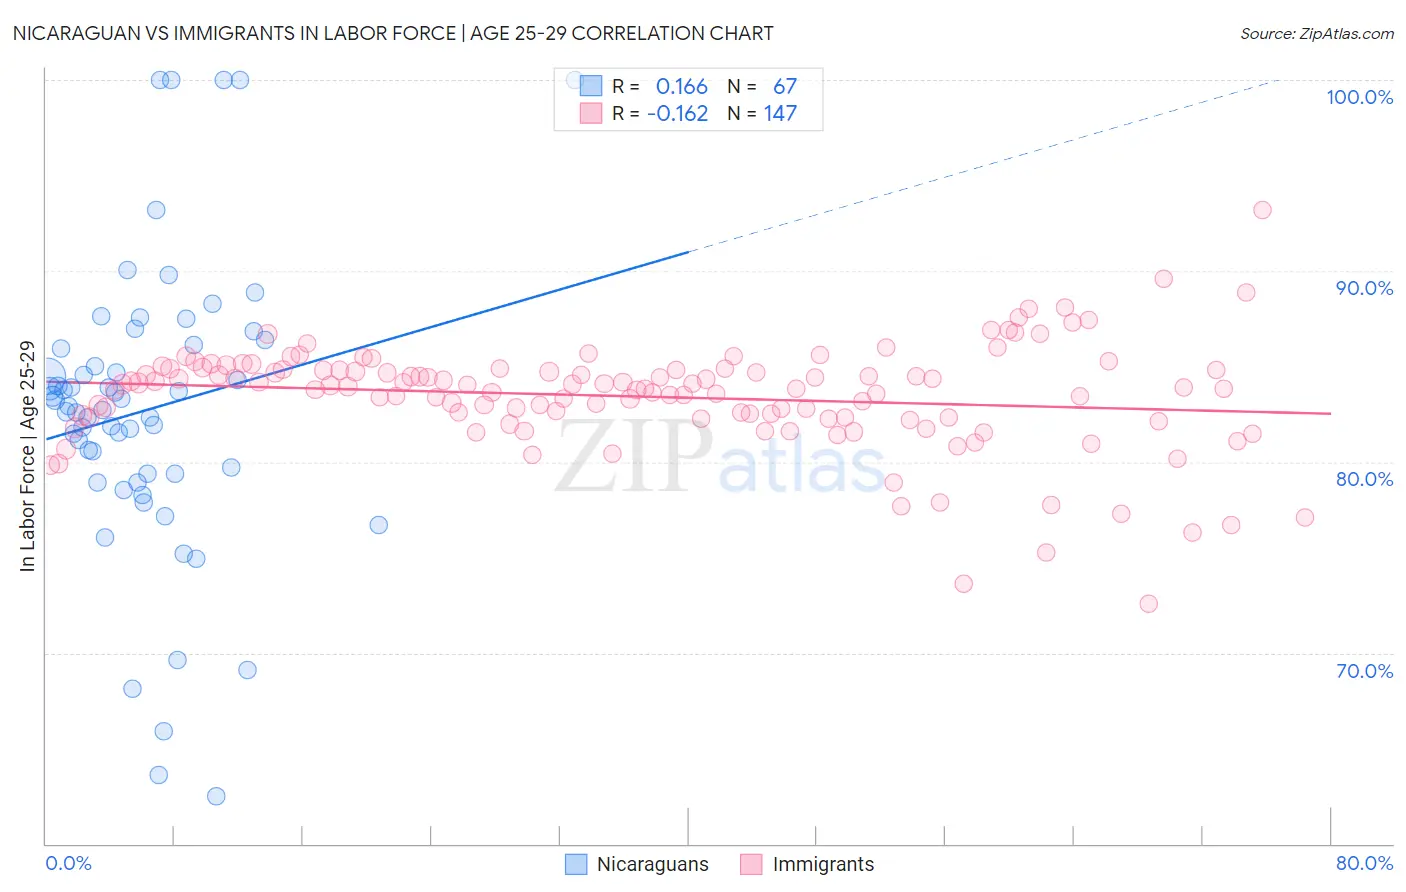
Nicaraguan vs Immigrants In Labor Force | Age 25-29 Correlation Chart
The statistical analysis conducted on geographies consisting of 285,680,331 people shows a poor positive correlation between the proportion of Nicaraguans and labor force participation rate among population between the ages 25 and 29 in the United States with a correlation coefficient (R) of 0.166 and weighted average of 83.1%. Similarly, the statistical analysis conducted on geographies consisting of 576,264,876 people shows a poor negative correlation between the proportion of Immigrants and labor force participation rate among population between the ages 25 and 29 in the United States with a correlation coefficient (R) of -0.162 and weighted average of 83.9%, a difference of 0.99%.
In Labor Force | Age 25-29 Correlation Summary
| Measurement | Nicaraguan | Immigrants |
| Minimum | 62.5% | 72.6% |
| Maximum | 100.0% | 93.2% |
| Range | 37.5% | 20.6% |
| Mean | 82.7% | 83.4% |
| Median | 82.9% | 83.9% |
| Interquartile 25% (IQ1) | 79.4% | 82.3% |
| Interquartile 75% (IQ3) | 86.1% | 84.8% |
| Interquartile Range (IQR) | 6.7% | 2.5% |
| Standard Deviation (Sample) | 7.7% | 2.8% |
| Standard Deviation (Population) | 7.7% | 2.8% |
Similar Demographics by In Labor Force | Age 25-29
Demographics Similar to Nicaraguans by In Labor Force | Age 25-29
In terms of in labor force | age 25-29, the demographic groups most similar to Nicaraguans are American (83.1%, a difference of 0.020%), Immigrants from the Azores (83.1%, a difference of 0.020%), Immigrants from Dominican Republic (83.1%, a difference of 0.030%), Belizean (83.1%, a difference of 0.030%), and Mexican American Indian (83.0%, a difference of 0.050%).
| Demographics | Rating | Rank | In Labor Force | Age 25-29 |
| Africans | 0.0 /100 | #277 | Tragic 83.2% |
| Immigrants | Cuba | 0.0 /100 | #278 | Tragic 83.2% |
| British West Indians | 0.0 /100 | #279 | Tragic 83.2% |
| Dominicans | 0.0 /100 | #280 | Tragic 83.2% |
| Immigrants | Dominican Republic | 0.0 /100 | #281 | Tragic 83.1% |
| Americans | 0.0 /100 | #282 | Tragic 83.1% |
| Immigrants | Azores | 0.0 /100 | #283 | Tragic 83.1% |
| Nicaraguans | 0.0 /100 | #284 | Tragic 83.1% |
| Belizeans | 0.0 /100 | #285 | Tragic 83.1% |
| Mexican American Indians | 0.0 /100 | #286 | Tragic 83.0% |
| Guyanese | 0.0 /100 | #287 | Tragic 83.0% |
| Ottawa | 0.0 /100 | #288 | Tragic 83.0% |
| Immigrants | Micronesia | 0.0 /100 | #289 | Tragic 83.0% |
| Immigrants | Bangladesh | 0.0 /100 | #290 | Tragic 83.0% |
| Hawaiians | 0.0 /100 | #291 | Tragic 83.0% |
Demographics Similar to Immigrants by In Labor Force | Age 25-29
In terms of in labor force | age 25-29, the demographic groups most similar to Immigrants are Guamanian/Chamorro (83.9%, a difference of 0.0%), Iraqi (83.9%, a difference of 0.010%), Barbadian (83.9%, a difference of 0.030%), Immigrants from Uzbekistan (83.9%, a difference of 0.030%), and Jamaican (83.9%, a difference of 0.030%).
| Demographics | Rating | Rank | In Labor Force | Age 25-29 |
| Whites/Caucasians | 4.8 /100 | #230 | Tragic 84.2% |
| Immigrants | Philippines | 4.7 /100 | #231 | Tragic 84.2% |
| Panamanians | 4.5 /100 | #232 | Tragic 84.2% |
| Immigrants | Western Asia | 2.7 /100 | #233 | Tragic 84.1% |
| Barbadians | 1.0 /100 | #234 | Tragic 83.9% |
| Iraqis | 0.9 /100 | #235 | Tragic 83.9% |
| Guamanians/Chamorros | 0.9 /100 | #236 | Tragic 83.9% |
| Immigrants | Immigrants | 0.9 /100 | #237 | Tragic 83.9% |
| Immigrants | Uzbekistan | 0.8 /100 | #238 | Tragic 83.9% |
| Jamaicans | 0.8 /100 | #239 | Tragic 83.9% |
| Trinidadians and Tobagonians | 0.7 /100 | #240 | Tragic 83.9% |
| Alsatians | 0.7 /100 | #241 | Tragic 83.9% |
| U.S. Virgin Islanders | 0.6 /100 | #242 | Tragic 83.8% |
| Salvadorans | 0.5 /100 | #243 | Tragic 83.8% |
| Immigrants | Jamaica | 0.4 /100 | #244 | Tragic 83.8% |