Nepalese vs Puerto Rican In Labor Force | Age 30-34
COMPARE
Nepalese
Puerto Rican
In Labor Force | Age 30-34
In Labor Force | Age 30-34 Comparison
Nepalese
Puerto Ricans
82.7%
IN LABOR FORCE | AGE 30-34
0.0/ 100
METRIC RATING
293rd/ 347
METRIC RANK
81.2%
IN LABOR FORCE | AGE 30-34
0.0/ 100
METRIC RATING
322nd/ 347
METRIC RANK
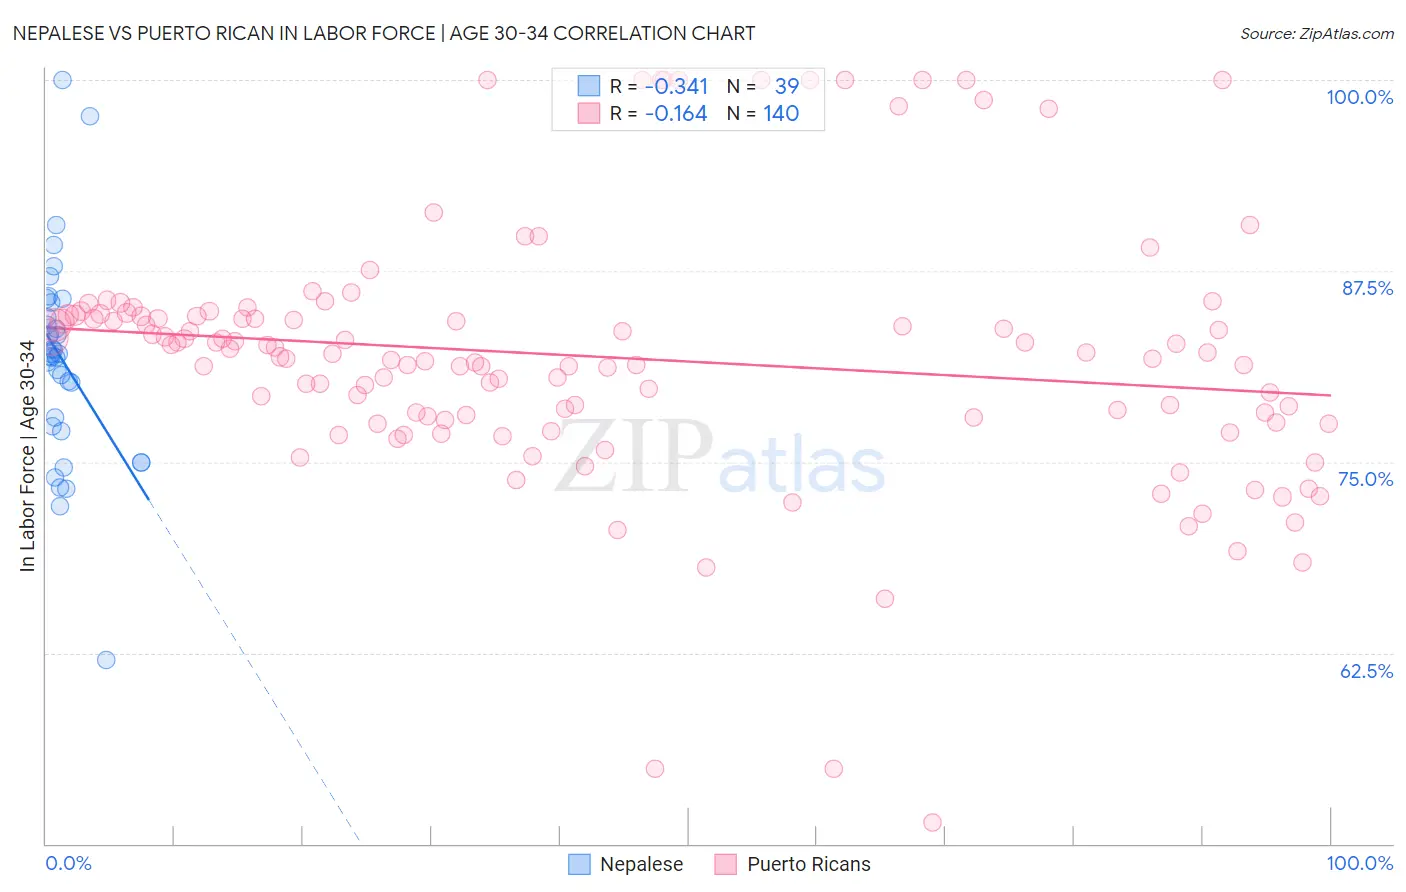
Nepalese vs Puerto Rican In Labor Force | Age 30-34 Correlation Chart
The statistical analysis conducted on geographies consisting of 24,520,458 people shows a mild negative correlation between the proportion of Nepalese and labor force participation rate among population between the ages 30 and 34 in the United States with a correlation coefficient (R) of -0.341 and weighted average of 82.7%. Similarly, the statistical analysis conducted on geographies consisting of 527,590,157 people shows a poor negative correlation between the proportion of Puerto Ricans and labor force participation rate among population between the ages 30 and 34 in the United States with a correlation coefficient (R) of -0.164 and weighted average of 81.2%, a difference of 1.9%.
In Labor Force | Age 30-34 Correlation Summary
| Measurement | Nepalese | Puerto Rican |
| Minimum | 62.0% | 51.4% |
| Maximum | 100.0% | 100.0% |
| Range | 38.0% | 48.6% |
| Mean | 81.7% | 81.9% |
| Median | 82.1% | 82.0% |
| Interquartile 25% (IQ1) | 77.3% | 77.8% |
| Interquartile 75% (IQ3) | 85.4% | 84.6% |
| Interquartile Range (IQR) | 8.1% | 6.8% |
| Standard Deviation (Sample) | 6.8% | 8.5% |
| Standard Deviation (Population) | 6.7% | 8.4% |
Similar Demographics by In Labor Force | Age 30-34
Demographics Similar to Nepalese by In Labor Force | Age 30-34
In terms of in labor force | age 30-34, the demographic groups most similar to Nepalese are American (82.7%, a difference of 0.020%), Black/African American (82.8%, a difference of 0.060%), Potawatomi (82.8%, a difference of 0.080%), Blackfeet (82.8%, a difference of 0.11%), and Pennsylvania German (82.6%, a difference of 0.14%).
| Demographics | Rating | Rank | In Labor Force | Age 30-34 |
| Immigrants | Latin America | 0.0 /100 | #286 | Tragic 83.1% |
| Native Hawaiians | 0.0 /100 | #287 | Tragic 83.0% |
| Central American Indians | 0.0 /100 | #288 | Tragic 83.0% |
| Hawaiians | 0.0 /100 | #289 | Tragic 83.0% |
| Blackfeet | 0.0 /100 | #290 | Tragic 82.8% |
| Potawatomi | 0.0 /100 | #291 | Tragic 82.8% |
| Blacks/African Americans | 0.0 /100 | #292 | Tragic 82.8% |
| Nepalese | 0.0 /100 | #293 | Tragic 82.7% |
| Americans | 0.0 /100 | #294 | Tragic 82.7% |
| Pennsylvania Germans | 0.0 /100 | #295 | Tragic 82.6% |
| Chippewa | 0.0 /100 | #296 | Tragic 82.6% |
| Comanche | 0.0 /100 | #297 | Tragic 82.6% |
| Aleuts | 0.0 /100 | #298 | Tragic 82.6% |
| Immigrants | Central America | 0.0 /100 | #299 | Tragic 82.5% |
| Hmong | 0.0 /100 | #300 | Tragic 82.4% |
Demographics Similar to Puerto Ricans by In Labor Force | Age 30-34
In terms of in labor force | age 30-34, the demographic groups most similar to Puerto Ricans are Paiute (81.2%, a difference of 0.050%), Cheyenne (81.1%, a difference of 0.080%), Alaska Native (81.3%, a difference of 0.16%), Dutch West Indian (81.0%, a difference of 0.23%), and Yaqui (81.4%, a difference of 0.24%).
| Demographics | Rating | Rank | In Labor Force | Age 30-34 |
| Cherokee | 0.0 /100 | #315 | Tragic 81.6% |
| Immigrants | Azores | 0.0 /100 | #316 | Tragic 81.5% |
| Arapaho | 0.0 /100 | #317 | Tragic 81.5% |
| Choctaw | 0.0 /100 | #318 | Tragic 81.4% |
| Shoshone | 0.0 /100 | #319 | Tragic 81.4% |
| Yaqui | 0.0 /100 | #320 | Tragic 81.4% |
| Alaska Natives | 0.0 /100 | #321 | Tragic 81.3% |
| Puerto Ricans | 0.0 /100 | #322 | Tragic 81.2% |
| Paiute | 0.0 /100 | #323 | Tragic 81.2% |
| Cheyenne | 0.0 /100 | #324 | Tragic 81.1% |
| Dutch West Indians | 0.0 /100 | #325 | Tragic 81.0% |
| Seminole | 0.0 /100 | #326 | Tragic 80.8% |
| Colville | 0.0 /100 | #327 | Tragic 80.7% |
| Sioux | 0.0 /100 | #328 | Tragic 80.4% |
| Creek | 0.0 /100 | #329 | Tragic 80.4% |