Immigrants from Nigeria vs Trinidadian and Tobagonian In Labor Force | Age 30-34
COMPARE
Immigrants from Nigeria
Trinidadian and Tobagonian
In Labor Force | Age 30-34
In Labor Force | Age 30-34 Comparison
Immigrants from Nigeria
Trinidadians and Tobagonians
84.6%
IN LABOR FORCE | AGE 30-34
42.5/ 100
METRIC RATING
179th/ 347
METRIC RANK
84.5%
IN LABOR FORCE | AGE 30-34
18.2/ 100
METRIC RATING
201st/ 347
METRIC RANK
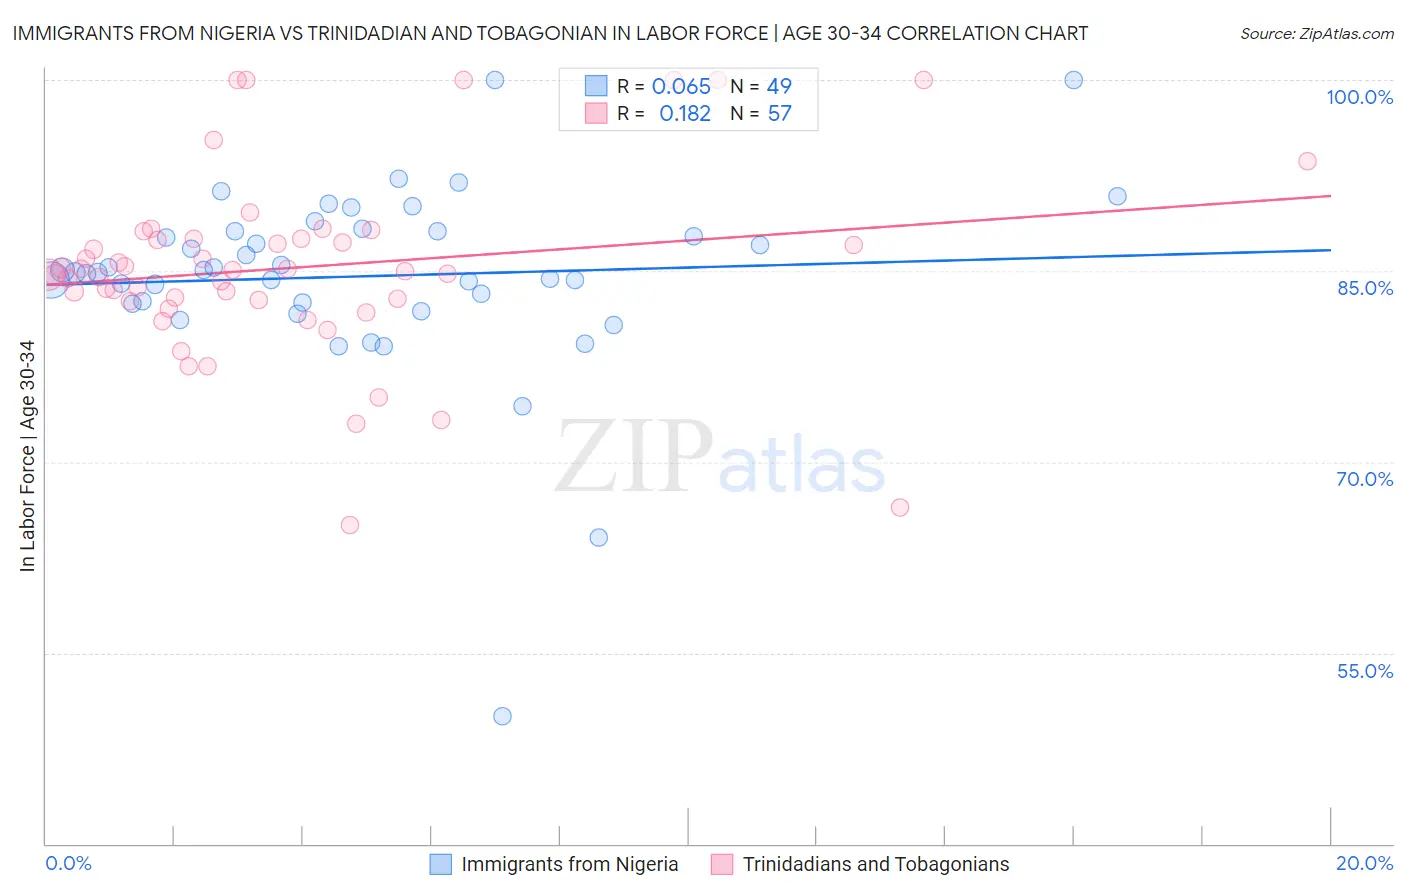
Immigrants from Nigeria vs Trinidadian and Tobagonian In Labor Force | Age 30-34 Correlation Chart
The statistical analysis conducted on geographies consisting of 283,347,406 people shows a slight positive correlation between the proportion of Immigrants from Nigeria and labor force participation rate among population between the ages 30 and 34 in the United States with a correlation coefficient (R) of 0.065 and weighted average of 84.6%. Similarly, the statistical analysis conducted on geographies consisting of 219,758,716 people shows a poor positive correlation between the proportion of Trinidadians and Tobagonians and labor force participation rate among population between the ages 30 and 34 in the United States with a correlation coefficient (R) of 0.182 and weighted average of 84.5%, a difference of 0.21%.
In Labor Force | Age 30-34 Correlation Summary
| Measurement | Immigrants from Nigeria | Trinidadian and Tobagonian |
| Minimum | 50.0% | 65.0% |
| Maximum | 100.0% | 100.0% |
| Range | 50.0% | 35.0% |
| Mean | 84.6% | 85.3% |
| Median | 84.9% | 84.9% |
| Interquartile 25% (IQ1) | 82.5% | 82.6% |
| Interquartile 75% (IQ3) | 88.1% | 87.5% |
| Interquartile Range (IQR) | 5.6% | 4.9% |
| Standard Deviation (Sample) | 7.6% | 7.3% |
| Standard Deviation (Population) | 7.5% | 7.3% |
Similar Demographics by In Labor Force | Age 30-34
Demographics Similar to Immigrants from Nigeria by In Labor Force | Age 30-34
In terms of in labor force | age 30-34, the demographic groups most similar to Immigrants from Nigeria are Immigrants from Netherlands (84.6%, a difference of 0.0%), Okinawan (84.6%, a difference of 0.010%), Moroccan (84.6%, a difference of 0.020%), Laotian (84.7%, a difference of 0.030%), and Barbadian (84.6%, a difference of 0.040%).
| Demographics | Rating | Rank | In Labor Force | Age 30-34 |
| Immigrants | England | 51.7 /100 | #172 | Average 84.7% |
| Israelis | 51.1 /100 | #173 | Average 84.7% |
| Finns | 50.0 /100 | #174 | Average 84.7% |
| Immigrants | South America | 50.0 /100 | #175 | Average 84.7% |
| Immigrants | Uzbekistan | 49.1 /100 | #176 | Average 84.7% |
| Laotians | 46.9 /100 | #177 | Average 84.7% |
| Okinawans | 44.1 /100 | #178 | Average 84.6% |
| Immigrants | Nigeria | 42.5 /100 | #179 | Average 84.6% |
| Immigrants | Netherlands | 42.1 /100 | #180 | Average 84.6% |
| Moroccans | 40.3 /100 | #181 | Average 84.6% |
| Barbadians | 36.7 /100 | #182 | Fair 84.6% |
| Immigrants | Canada | 35.0 /100 | #183 | Fair 84.6% |
| Immigrants | North America | 33.3 /100 | #184 | Fair 84.6% |
| Immigrants | Philippines | 31.5 /100 | #185 | Fair 84.6% |
| Immigrants | Congo | 29.7 /100 | #186 | Fair 84.6% |
Demographics Similar to Trinidadians and Tobagonians by In Labor Force | Age 30-34
In terms of in labor force | age 30-34, the demographic groups most similar to Trinidadians and Tobagonians are Immigrants from West Indies (84.5%, a difference of 0.0%), Immigrants from Thailand (84.5%, a difference of 0.010%), Subsaharan African (84.5%, a difference of 0.010%), Dutch (84.5%, a difference of 0.020%), and Canadian (84.4%, a difference of 0.030%).
| Demographics | Rating | Rank | In Labor Force | Age 30-34 |
| Immigrants | Afghanistan | 23.5 /100 | #194 | Fair 84.5% |
| Koreans | 23.2 /100 | #195 | Fair 84.5% |
| British | 22.9 /100 | #196 | Fair 84.5% |
| Immigrants | Syria | 21.9 /100 | #197 | Fair 84.5% |
| Dutch | 20.2 /100 | #198 | Fair 84.5% |
| Immigrants | Thailand | 19.1 /100 | #199 | Poor 84.5% |
| Sub-Saharan Africans | 19.0 /100 | #200 | Poor 84.5% |
| Trinidadians and Tobagonians | 18.2 /100 | #201 | Poor 84.5% |
| Immigrants | West Indies | 18.1 /100 | #202 | Poor 84.5% |
| Canadians | 15.4 /100 | #203 | Poor 84.4% |
| Ecuadorians | 14.2 /100 | #204 | Poor 84.4% |
| French | 13.8 /100 | #205 | Poor 84.4% |
| Lebanese | 10.6 /100 | #206 | Poor 84.4% |
| Bangladeshis | 9.4 /100 | #207 | Tragic 84.3% |
| Arabs | 8.9 /100 | #208 | Tragic 84.3% |