Immigrants from Trinidad and Tobago vs Trinidadian and Tobagonian In Labor Force | Age 30-34
COMPARE
Immigrants from Trinidad and Tobago
Trinidadian and Tobagonian
In Labor Force | Age 30-34
In Labor Force | Age 30-34 Comparison
Immigrants from Trinidad and Tobago
Trinidadians and Tobagonians
84.3%
IN LABOR FORCE | AGE 30-34
7.0/ 100
METRIC RATING
217th/ 347
METRIC RANK
84.5%
IN LABOR FORCE | AGE 30-34
18.2/ 100
METRIC RATING
201st/ 347
METRIC RANK
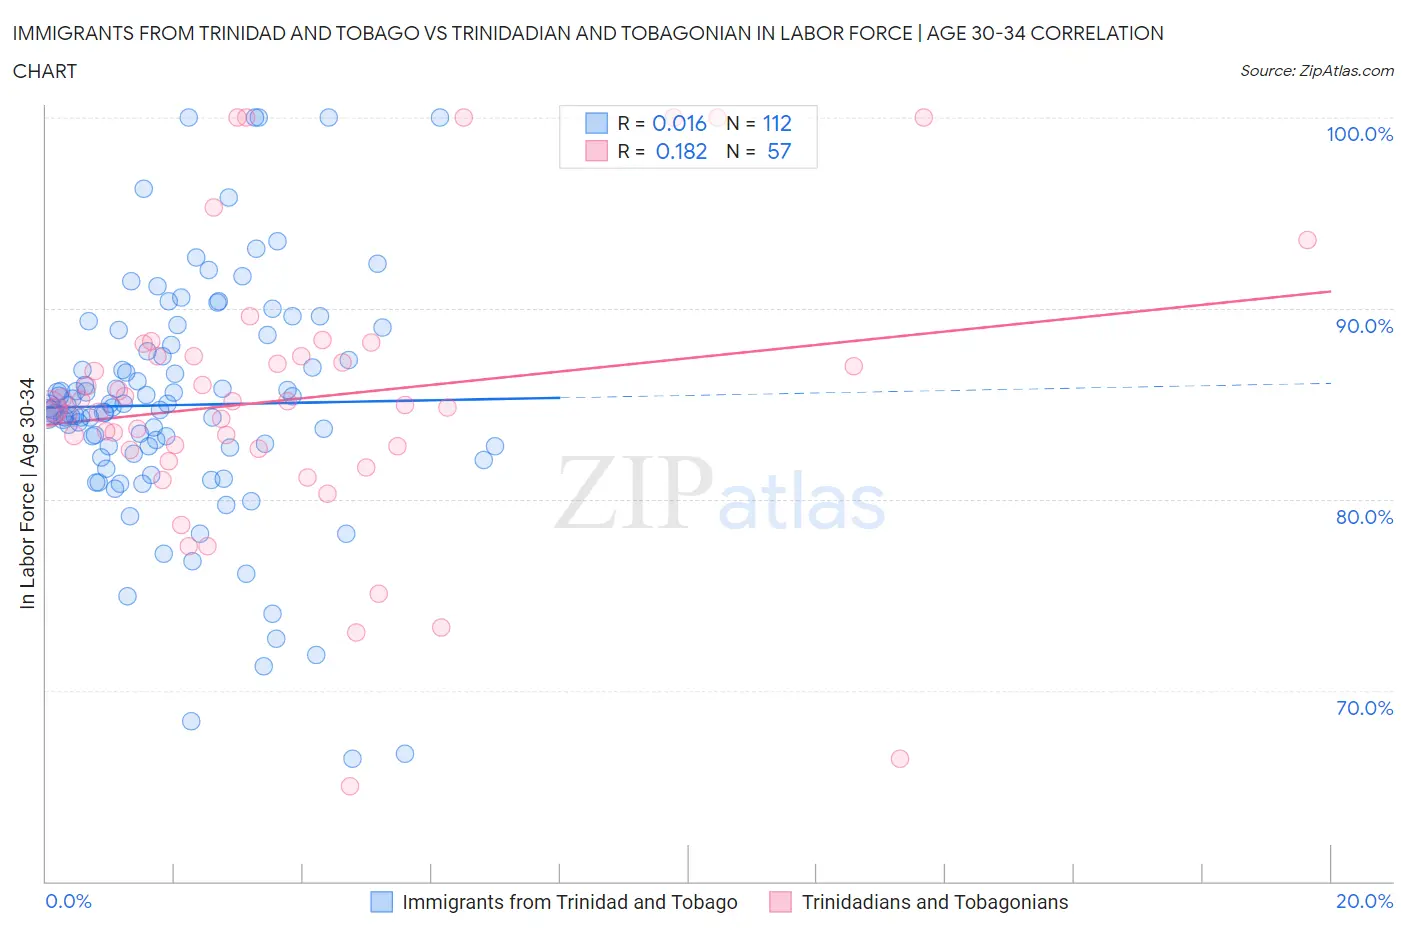
Immigrants from Trinidad and Tobago vs Trinidadian and Tobagonian In Labor Force | Age 30-34 Correlation Chart
The statistical analysis conducted on geographies consisting of 223,505,826 people shows no correlation between the proportion of Immigrants from Trinidad and Tobago and labor force participation rate among population between the ages 30 and 34 in the United States with a correlation coefficient (R) of 0.016 and weighted average of 84.3%. Similarly, the statistical analysis conducted on geographies consisting of 219,758,716 people shows a poor positive correlation between the proportion of Trinidadians and Tobagonians and labor force participation rate among population between the ages 30 and 34 in the United States with a correlation coefficient (R) of 0.182 and weighted average of 84.5%, a difference of 0.19%.
In Labor Force | Age 30-34 Correlation Summary
| Measurement | Immigrants from Trinidad and Tobago | Trinidadian and Tobagonian |
| Minimum | 66.4% | 65.0% |
| Maximum | 100.0% | 100.0% |
| Range | 33.6% | 35.0% |
| Mean | 84.9% | 85.3% |
| Median | 84.8% | 84.9% |
| Interquartile 25% (IQ1) | 82.6% | 82.6% |
| Interquartile 75% (IQ3) | 87.9% | 87.5% |
| Interquartile Range (IQR) | 5.4% | 4.9% |
| Standard Deviation (Sample) | 6.3% | 7.3% |
| Standard Deviation (Population) | 6.3% | 7.3% |
Demographics Similar to Immigrants from Trinidad and Tobago and Trinidadians and Tobagonians by In Labor Force | Age 30-34
In terms of in labor force | age 30-34, the demographic groups most similar to Immigrants from Trinidad and Tobago are Immigrants from Ecuador (84.3%, a difference of 0.0%), Immigrants from Germany (84.3%, a difference of 0.010%), European (84.3%, a difference of 0.010%), Immigrants from Jamaica (84.3%, a difference of 0.020%), and Immigrants from Panama (84.3%, a difference of 0.020%). Similarly, the demographic groups most similar to Trinidadians and Tobagonians are Immigrants from West Indies (84.5%, a difference of 0.0%), Immigrants from Thailand (84.5%, a difference of 0.010%), Subsaharan African (84.5%, a difference of 0.010%), Canadian (84.4%, a difference of 0.030%), and Ecuadorian (84.4%, a difference of 0.050%).
| Demographics | Rating | Rank | In Labor Force | Age 30-34 |
| Immigrants | Thailand | 19.1 /100 | #199 | Poor 84.5% |
| Sub-Saharan Africans | 19.0 /100 | #200 | Poor 84.5% |
| Trinidadians and Tobagonians | 18.2 /100 | #201 | Poor 84.5% |
| Immigrants | West Indies | 18.1 /100 | #202 | Poor 84.5% |
| Canadians | 15.4 /100 | #203 | Poor 84.4% |
| Ecuadorians | 14.2 /100 | #204 | Poor 84.4% |
| French | 13.8 /100 | #205 | Poor 84.4% |
| Lebanese | 10.6 /100 | #206 | Poor 84.4% |
| Bangladeshis | 9.4 /100 | #207 | Tragic 84.3% |
| Arabs | 8.9 /100 | #208 | Tragic 84.3% |
| Jamaicans | 8.8 /100 | #209 | Tragic 84.3% |
| Indonesians | 8.8 /100 | #210 | Tragic 84.3% |
| Japanese | 8.8 /100 | #211 | Tragic 84.3% |
| Immigrants | Western Asia | 8.2 /100 | #212 | Tragic 84.3% |
| Immigrants | Jamaica | 7.9 /100 | #213 | Tragic 84.3% |
| Immigrants | Germany | 7.2 /100 | #214 | Tragic 84.3% |
| Europeans | 7.2 /100 | #215 | Tragic 84.3% |
| Immigrants | Ecuador | 7.1 /100 | #216 | Tragic 84.3% |
| Immigrants | Trinidad and Tobago | 7.0 /100 | #217 | Tragic 84.3% |
| Immigrants | Panama | 6.3 /100 | #218 | Tragic 84.3% |
| Swiss | 5.8 /100 | #219 | Tragic 84.3% |