Nepalese vs Immigrants from Middle Africa In Labor Force | Age 30-34
COMPARE
Nepalese
Immigrants from Middle Africa
In Labor Force | Age 30-34
In Labor Force | Age 30-34 Comparison
Nepalese
Immigrants from Middle Africa
82.7%
IN LABOR FORCE | AGE 30-34
0.0/ 100
METRIC RATING
293rd/ 347
METRIC RANK
85.2%
IN LABOR FORCE | AGE 30-34
96.3/ 100
METRIC RATING
106th/ 347
METRIC RANK
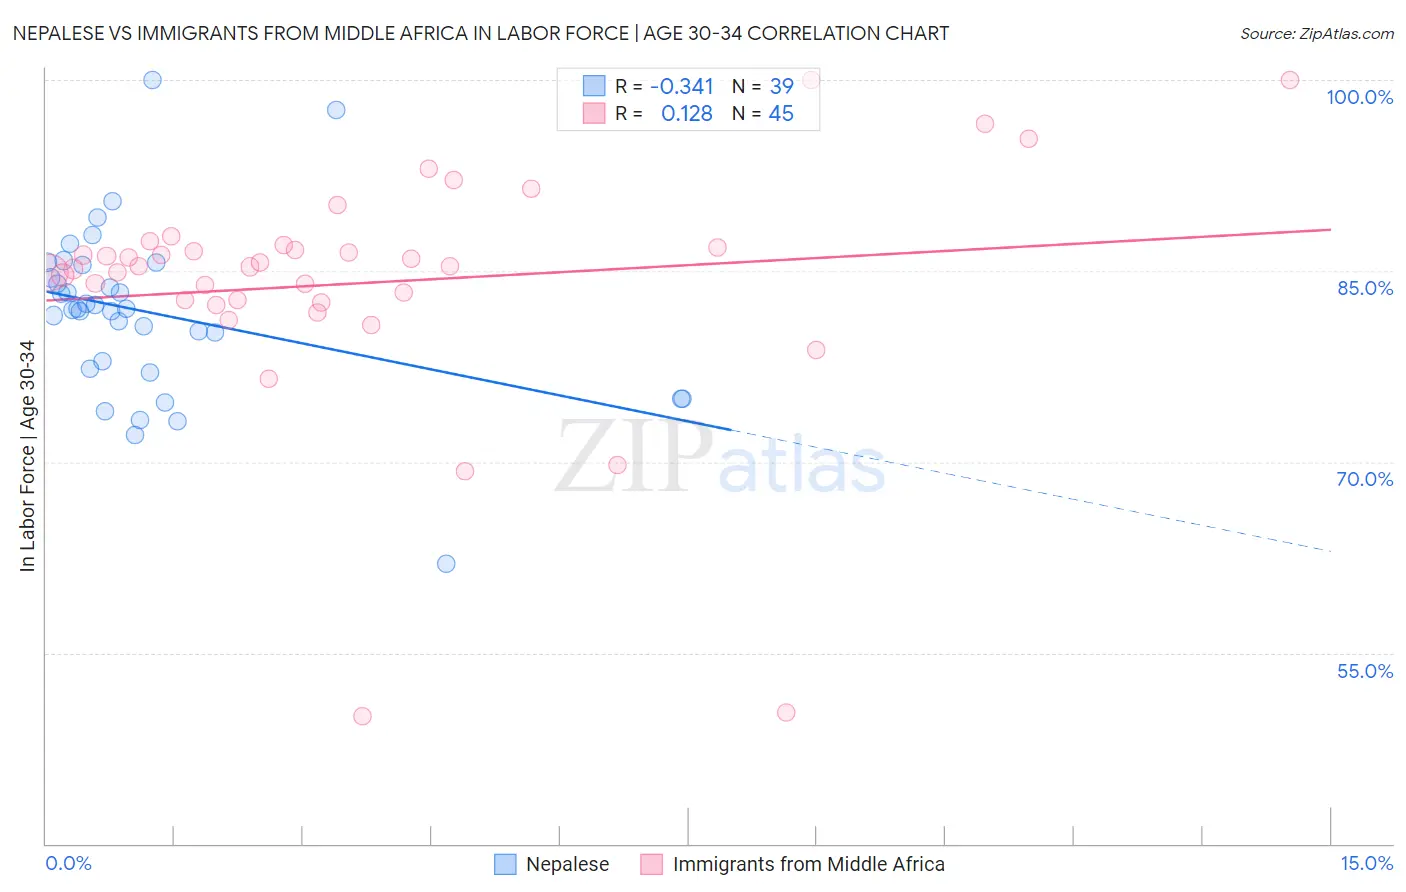
Nepalese vs Immigrants from Middle Africa In Labor Force | Age 30-34 Correlation Chart
The statistical analysis conducted on geographies consisting of 24,520,458 people shows a mild negative correlation between the proportion of Nepalese and labor force participation rate among population between the ages 30 and 34 in the United States with a correlation coefficient (R) of -0.341 and weighted average of 82.7%. Similarly, the statistical analysis conducted on geographies consisting of 202,689,912 people shows a poor positive correlation between the proportion of Immigrants from Middle Africa and labor force participation rate among population between the ages 30 and 34 in the United States with a correlation coefficient (R) of 0.128 and weighted average of 85.2%, a difference of 3.0%.
In Labor Force | Age 30-34 Correlation Summary
| Measurement | Nepalese | Immigrants from Middle Africa |
| Minimum | 62.0% | 50.0% |
| Maximum | 100.0% | 100.0% |
| Range | 38.0% | 50.0% |
| Mean | 81.7% | 84.1% |
| Median | 82.1% | 85.3% |
| Interquartile 25% (IQ1) | 77.3% | 82.6% |
| Interquartile 75% (IQ3) | 85.4% | 86.9% |
| Interquartile Range (IQR) | 8.1% | 4.3% |
| Standard Deviation (Sample) | 6.8% | 9.5% |
| Standard Deviation (Population) | 6.7% | 9.4% |
Similar Demographics by In Labor Force | Age 30-34
Demographics Similar to Nepalese by In Labor Force | Age 30-34
In terms of in labor force | age 30-34, the demographic groups most similar to Nepalese are American (82.7%, a difference of 0.020%), Black/African American (82.8%, a difference of 0.060%), Potawatomi (82.8%, a difference of 0.080%), Blackfeet (82.8%, a difference of 0.11%), and Pennsylvania German (82.6%, a difference of 0.14%).
| Demographics | Rating | Rank | In Labor Force | Age 30-34 |
| Immigrants | Latin America | 0.0 /100 | #286 | Tragic 83.1% |
| Native Hawaiians | 0.0 /100 | #287 | Tragic 83.0% |
| Central American Indians | 0.0 /100 | #288 | Tragic 83.0% |
| Hawaiians | 0.0 /100 | #289 | Tragic 83.0% |
| Blackfeet | 0.0 /100 | #290 | Tragic 82.8% |
| Potawatomi | 0.0 /100 | #291 | Tragic 82.8% |
| Blacks/African Americans | 0.0 /100 | #292 | Tragic 82.8% |
| Nepalese | 0.0 /100 | #293 | Tragic 82.7% |
| Americans | 0.0 /100 | #294 | Tragic 82.7% |
| Pennsylvania Germans | 0.0 /100 | #295 | Tragic 82.6% |
| Chippewa | 0.0 /100 | #296 | Tragic 82.6% |
| Comanche | 0.0 /100 | #297 | Tragic 82.6% |
| Aleuts | 0.0 /100 | #298 | Tragic 82.6% |
| Immigrants | Central America | 0.0 /100 | #299 | Tragic 82.5% |
| Hmong | 0.0 /100 | #300 | Tragic 82.4% |
Demographics Similar to Immigrants from Middle Africa by In Labor Force | Age 30-34
In terms of in labor force | age 30-34, the demographic groups most similar to Immigrants from Middle Africa are Alsatian (85.2%, a difference of 0.0%), Immigrants from Northern Africa (85.2%, a difference of 0.0%), Ukrainian (85.2%, a difference of 0.010%), Immigrants from Ghana (85.2%, a difference of 0.010%), and Immigrants from Austria (85.2%, a difference of 0.020%).
| Demographics | Rating | Rank | In Labor Force | Age 30-34 |
| Belgians | 97.2 /100 | #99 | Exceptional 85.2% |
| Sudanese | 97.1 /100 | #100 | Exceptional 85.2% |
| Immigrants | Belarus | 96.9 /100 | #101 | Exceptional 85.2% |
| Immigrants | Austria | 96.8 /100 | #102 | Exceptional 85.2% |
| Ukrainians | 96.6 /100 | #103 | Exceptional 85.2% |
| Immigrants | Ghana | 96.5 /100 | #104 | Exceptional 85.2% |
| Alsatians | 96.3 /100 | #105 | Exceptional 85.2% |
| Immigrants | Middle Africa | 96.3 /100 | #106 | Exceptional 85.2% |
| Immigrants | Northern Africa | 96.3 /100 | #107 | Exceptional 85.2% |
| Immigrants | Zimbabwe | 95.8 /100 | #108 | Exceptional 85.1% |
| Argentineans | 95.8 /100 | #109 | Exceptional 85.1% |
| Immigrants | South Africa | 95.3 /100 | #110 | Exceptional 85.1% |
| Immigrants | Scotland | 94.9 /100 | #111 | Exceptional 85.1% |
| Immigrants | Hungary | 94.8 /100 | #112 | Exceptional 85.1% |
| Immigrants | Romania | 94.7 /100 | #113 | Exceptional 85.1% |