Immigrants from Lebanon vs Trinidadian and Tobagonian In Labor Force | Age 30-34
COMPARE
Immigrants from Lebanon
Trinidadian and Tobagonian
In Labor Force | Age 30-34
In Labor Force | Age 30-34 Comparison
Immigrants from Lebanon
Trinidadians and Tobagonians
83.9%
IN LABOR FORCE | AGE 30-34
0.4/ 100
METRIC RATING
256th/ 347
METRIC RANK
84.5%
IN LABOR FORCE | AGE 30-34
18.2/ 100
METRIC RATING
201st/ 347
METRIC RANK
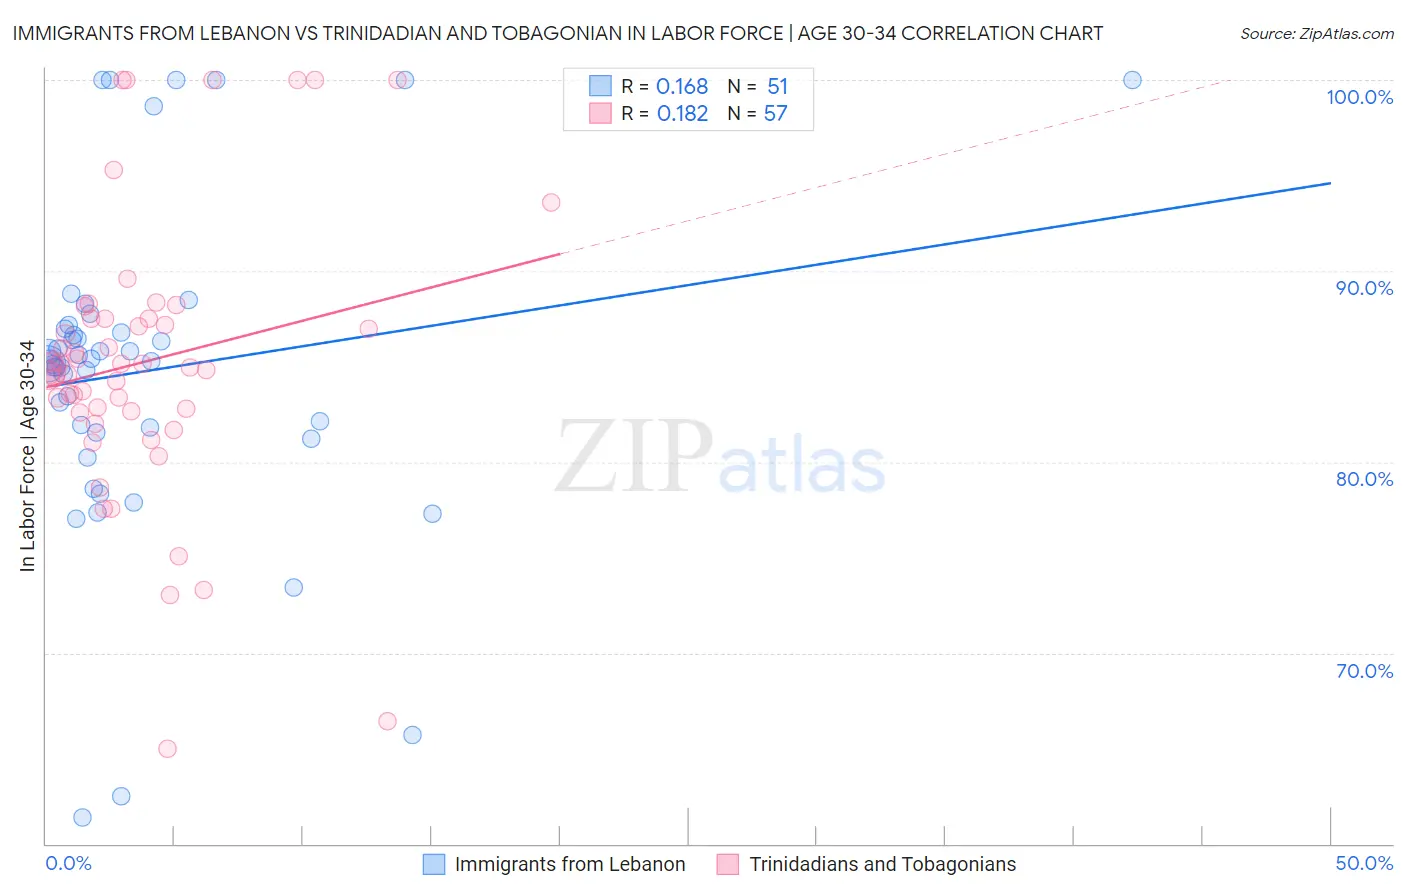
Immigrants from Lebanon vs Trinidadian and Tobagonian In Labor Force | Age 30-34 Correlation Chart
The statistical analysis conducted on geographies consisting of 217,118,980 people shows a poor positive correlation between the proportion of Immigrants from Lebanon and labor force participation rate among population between the ages 30 and 34 in the United States with a correlation coefficient (R) of 0.168 and weighted average of 83.9%. Similarly, the statistical analysis conducted on geographies consisting of 219,758,716 people shows a poor positive correlation between the proportion of Trinidadians and Tobagonians and labor force participation rate among population between the ages 30 and 34 in the United States with a correlation coefficient (R) of 0.182 and weighted average of 84.5%, a difference of 0.73%.
In Labor Force | Age 30-34 Correlation Summary
| Measurement | Immigrants from Lebanon | Trinidadian and Tobagonian |
| Minimum | 61.4% | 65.0% |
| Maximum | 100.0% | 100.0% |
| Range | 38.6% | 35.0% |
| Mean | 84.8% | 85.3% |
| Median | 85.3% | 84.9% |
| Interquartile 25% (IQ1) | 81.5% | 82.6% |
| Interquartile 75% (IQ3) | 87.0% | 87.5% |
| Interquartile Range (IQR) | 5.5% | 4.9% |
| Standard Deviation (Sample) | 8.5% | 7.3% |
| Standard Deviation (Population) | 8.4% | 7.3% |
Similar Demographics by In Labor Force | Age 30-34
Demographics Similar to Immigrants from Lebanon by In Labor Force | Age 30-34
In terms of in labor force | age 30-34, the demographic groups most similar to Immigrants from Lebanon are Iraqi (83.8%, a difference of 0.010%), White/Caucasian (83.9%, a difference of 0.040%), Honduran (83.8%, a difference of 0.040%), Scotch-Irish (83.8%, a difference of 0.050%), and Immigrants from St. Vincent and the Grenadines (83.9%, a difference of 0.060%).
| Demographics | Rating | Rank | In Labor Force | Age 30-34 |
| Immigrants | Dominica | 0.7 /100 | #249 | Tragic 84.0% |
| Immigrants | Iraq | 0.7 /100 | #250 | Tragic 83.9% |
| Nicaraguans | 0.6 /100 | #251 | Tragic 83.9% |
| Bahamians | 0.6 /100 | #252 | Tragic 83.9% |
| Immigrants | Nicaragua | 0.6 /100 | #253 | Tragic 83.9% |
| Immigrants | St. Vincent and the Grenadines | 0.5 /100 | #254 | Tragic 83.9% |
| Whites/Caucasians | 0.5 /100 | #255 | Tragic 83.9% |
| Immigrants | Lebanon | 0.4 /100 | #256 | Tragic 83.9% |
| Iraqis | 0.3 /100 | #257 | Tragic 83.8% |
| Hondurans | 0.3 /100 | #258 | Tragic 83.8% |
| Scotch-Irish | 0.3 /100 | #259 | Tragic 83.8% |
| Immigrants | Dominican Republic | 0.3 /100 | #260 | Tragic 83.8% |
| Guyanese | 0.3 /100 | #261 | Tragic 83.8% |
| Dominicans | 0.2 /100 | #262 | Tragic 83.8% |
| Immigrants | Guyana | 0.2 /100 | #263 | Tragic 83.8% |
Demographics Similar to Trinidadians and Tobagonians by In Labor Force | Age 30-34
In terms of in labor force | age 30-34, the demographic groups most similar to Trinidadians and Tobagonians are Immigrants from West Indies (84.5%, a difference of 0.0%), Immigrants from Thailand (84.5%, a difference of 0.010%), Subsaharan African (84.5%, a difference of 0.010%), Dutch (84.5%, a difference of 0.020%), and Canadian (84.4%, a difference of 0.030%).
| Demographics | Rating | Rank | In Labor Force | Age 30-34 |
| Immigrants | Afghanistan | 23.5 /100 | #194 | Fair 84.5% |
| Koreans | 23.2 /100 | #195 | Fair 84.5% |
| British | 22.9 /100 | #196 | Fair 84.5% |
| Immigrants | Syria | 21.9 /100 | #197 | Fair 84.5% |
| Dutch | 20.2 /100 | #198 | Fair 84.5% |
| Immigrants | Thailand | 19.1 /100 | #199 | Poor 84.5% |
| Sub-Saharan Africans | 19.0 /100 | #200 | Poor 84.5% |
| Trinidadians and Tobagonians | 18.2 /100 | #201 | Poor 84.5% |
| Immigrants | West Indies | 18.1 /100 | #202 | Poor 84.5% |
| Canadians | 15.4 /100 | #203 | Poor 84.4% |
| Ecuadorians | 14.2 /100 | #204 | Poor 84.4% |
| French | 13.8 /100 | #205 | Poor 84.4% |
| Lebanese | 10.6 /100 | #206 | Poor 84.4% |
| Bangladeshis | 9.4 /100 | #207 | Tragic 84.3% |
| Arabs | 8.9 /100 | #208 | Tragic 84.3% |