Nepalese vs Immigrants from Northern Europe In Labor Force | Age 25-29
COMPARE
Nepalese
Immigrants from Northern Europe
In Labor Force | Age 25-29
In Labor Force | Age 25-29 Comparison
Nepalese
Immigrants from Northern Europe
82.9%
IN LABOR FORCE | AGE 25-29
0.0/ 100
METRIC RATING
294th/ 347
METRIC RANK
85.2%
IN LABOR FORCE | AGE 25-29
97.2/ 100
METRIC RATING
81st/ 347
METRIC RANK
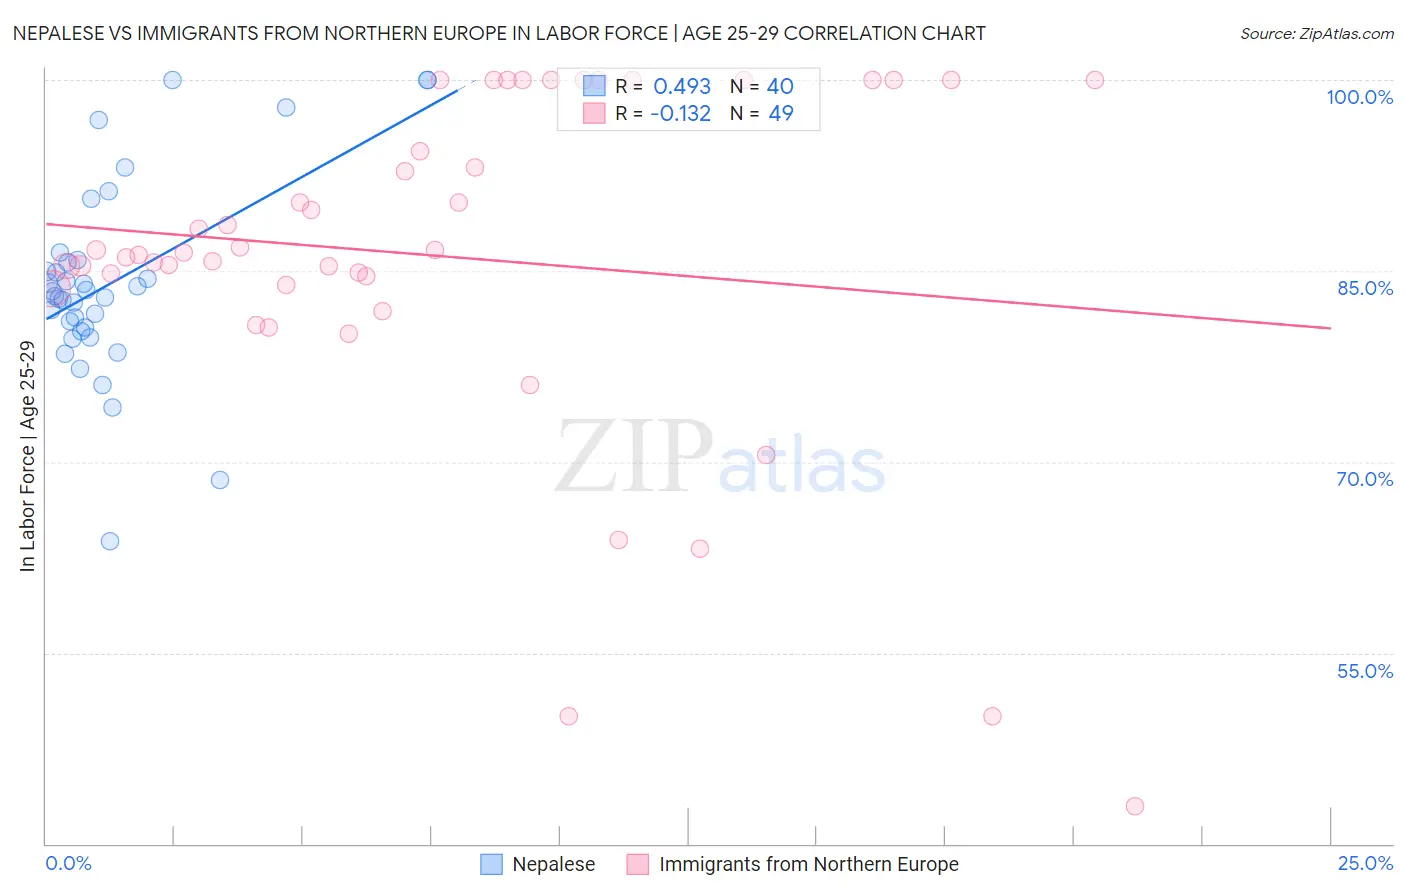
Nepalese vs Immigrants from Northern Europe In Labor Force | Age 25-29 Correlation Chart
The statistical analysis conducted on geographies consisting of 24,521,755 people shows a moderate positive correlation between the proportion of Nepalese and labor force participation rate among population between the ages 25 and 29 in the United States with a correlation coefficient (R) of 0.493 and weighted average of 82.9%. Similarly, the statistical analysis conducted on geographies consisting of 476,832,999 people shows a poor negative correlation between the proportion of Immigrants from Northern Europe and labor force participation rate among population between the ages 25 and 29 in the United States with a correlation coefficient (R) of -0.132 and weighted average of 85.2%, a difference of 2.8%.
In Labor Force | Age 25-29 Correlation Summary
| Measurement | Nepalese | Immigrants from Northern Europe |
| Minimum | 63.8% | 42.9% |
| Maximum | 100.0% | 100.0% |
| Range | 36.2% | 57.1% |
| Mean | 84.1% | 86.2% |
| Median | 83.2% | 86.5% |
| Interquartile 25% (IQ1) | 80.4% | 83.8% |
| Interquartile 75% (IQ3) | 85.8% | 100.0% |
| Interquartile Range (IQR) | 5.4% | 16.2% |
| Standard Deviation (Sample) | 7.7% | 13.5% |
| Standard Deviation (Population) | 7.6% | 13.3% |
Similar Demographics by In Labor Force | Age 25-29
Demographics Similar to Nepalese by In Labor Force | Age 25-29
In terms of in labor force | age 25-29, the demographic groups most similar to Nepalese are Immigrants from Latin America (82.9%, a difference of 0.0%), Chippewa (82.9%, a difference of 0.0%), Immigrants from Nicaragua (82.9%, a difference of 0.0%), Potawatomi (82.9%, a difference of 0.010%), and Native Hawaiian (82.9%, a difference of 0.020%).
| Demographics | Rating | Rank | In Labor Force | Age 25-29 |
| Guyanese | 0.0 /100 | #287 | Tragic 83.0% |
| Ottawa | 0.0 /100 | #288 | Tragic 83.0% |
| Immigrants | Micronesia | 0.0 /100 | #289 | Tragic 83.0% |
| Immigrants | Bangladesh | 0.0 /100 | #290 | Tragic 83.0% |
| Hawaiians | 0.0 /100 | #291 | Tragic 83.0% |
| Immigrants | Guyana | 0.0 /100 | #292 | Tragic 83.0% |
| Immigrants | Latin America | 0.0 /100 | #293 | Tragic 82.9% |
| Nepalese | 0.0 /100 | #294 | Tragic 82.9% |
| Chippewa | 0.0 /100 | #295 | Tragic 82.9% |
| Immigrants | Nicaragua | 0.0 /100 | #296 | Tragic 82.9% |
| Potawatomi | 0.0 /100 | #297 | Tragic 82.9% |
| Native Hawaiians | 0.0 /100 | #298 | Tragic 82.9% |
| Fijians | 0.0 /100 | #299 | Tragic 82.9% |
| Spanish American Indians | 0.0 /100 | #300 | Tragic 82.9% |
| Vietnamese | 0.0 /100 | #301 | Tragic 82.8% |
Demographics Similar to Immigrants from Northern Europe by In Labor Force | Age 25-29
In terms of in labor force | age 25-29, the demographic groups most similar to Immigrants from Northern Europe are Immigrants from Zimbabwe (85.2%, a difference of 0.020%), Okinawan (85.2%, a difference of 0.020%), Immigrants from Egypt (85.2%, a difference of 0.030%), Immigrants from Northern Africa (85.2%, a difference of 0.030%), and Immigrants from Europe (85.2%, a difference of 0.030%).
| Demographics | Rating | Rank | In Labor Force | Age 25-29 |
| Soviet Union | 98.5 /100 | #74 | Exceptional 85.3% |
| Brazilians | 98.3 /100 | #75 | Exceptional 85.3% |
| Germans | 98.1 /100 | #76 | Exceptional 85.3% |
| Immigrants | South Central Asia | 97.9 /100 | #77 | Exceptional 85.2% |
| Immigrants | Egypt | 97.7 /100 | #78 | Exceptional 85.2% |
| Immigrants | Northern Africa | 97.6 /100 | #79 | Exceptional 85.2% |
| Immigrants | Zimbabwe | 97.6 /100 | #80 | Exceptional 85.2% |
| Immigrants | Northern Europe | 97.2 /100 | #81 | Exceptional 85.2% |
| Okinawans | 97.0 /100 | #82 | Exceptional 85.2% |
| Immigrants | Europe | 96.8 /100 | #83 | Exceptional 85.2% |
| Immigrants | Eastern Europe | 96.8 /100 | #84 | Exceptional 85.2% |
| Immigrants | Africa | 96.7 /100 | #85 | Exceptional 85.2% |
| Ukrainians | 96.7 /100 | #86 | Exceptional 85.2% |
| French Canadians | 96.5 /100 | #87 | Exceptional 85.2% |
| Immigrants | Croatia | 96.4 /100 | #88 | Exceptional 85.2% |