Somali vs Immigrants from Northern Europe In Labor Force | Age 25-29
COMPARE
Somali
Immigrants from Northern Europe
In Labor Force | Age 25-29
In Labor Force | Age 25-29 Comparison
Somalis
Immigrants from Northern Europe
87.1%
IN LABOR FORCE | AGE 25-29
100.0/ 100
METRIC RATING
3rd/ 347
METRIC RANK
85.2%
IN LABOR FORCE | AGE 25-29
97.2/ 100
METRIC RATING
81st/ 347
METRIC RANK
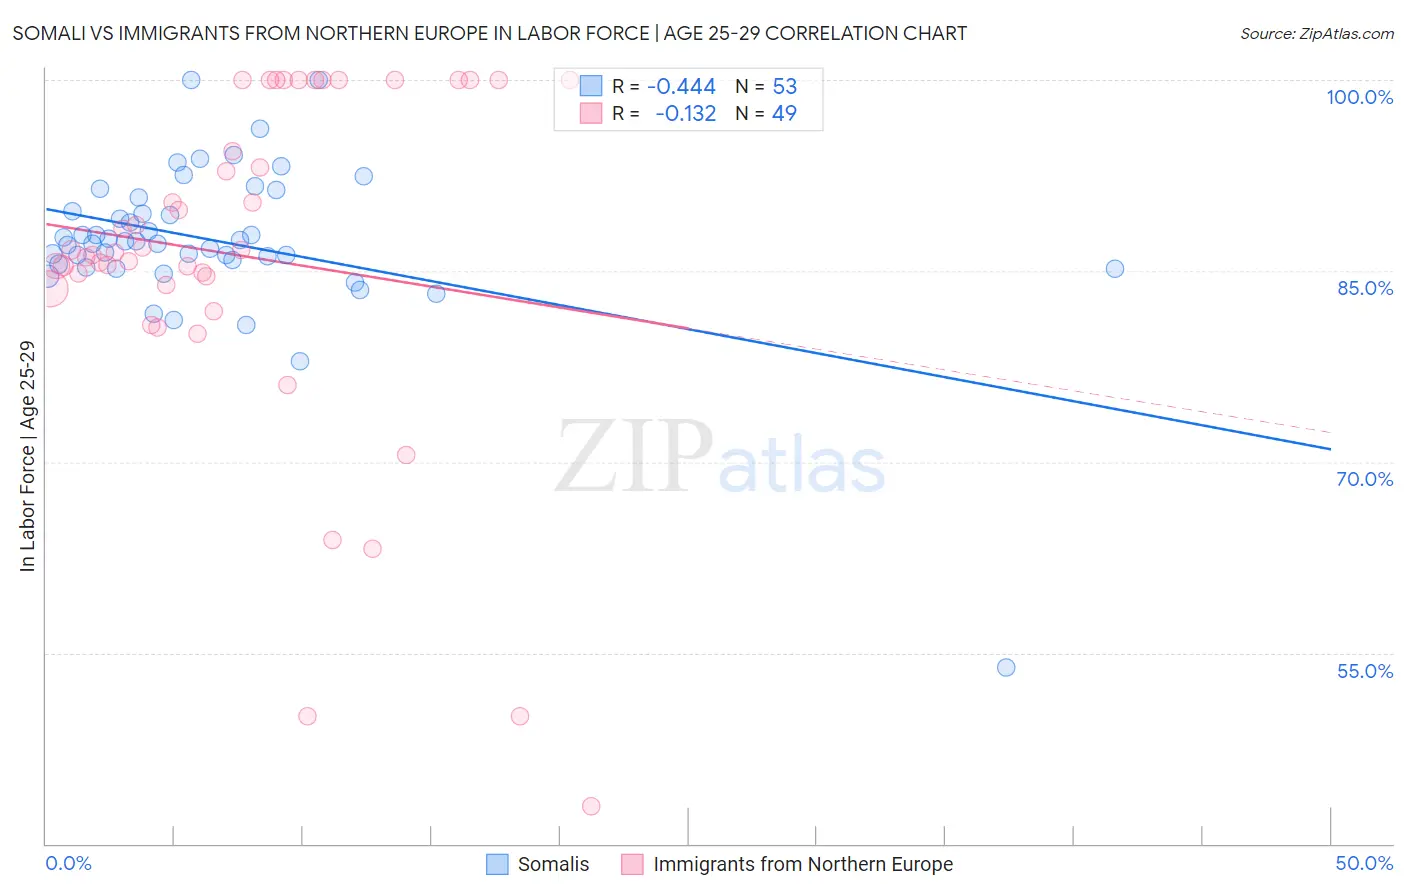
Somali vs Immigrants from Northern Europe In Labor Force | Age 25-29 Correlation Chart
The statistical analysis conducted on geographies consisting of 99,327,159 people shows a moderate negative correlation between the proportion of Somalis and labor force participation rate among population between the ages 25 and 29 in the United States with a correlation coefficient (R) of -0.444 and weighted average of 87.1%. Similarly, the statistical analysis conducted on geographies consisting of 476,832,999 people shows a poor negative correlation between the proportion of Immigrants from Northern Europe and labor force participation rate among population between the ages 25 and 29 in the United States with a correlation coefficient (R) of -0.132 and weighted average of 85.2%, a difference of 2.2%.
In Labor Force | Age 25-29 Correlation Summary
| Measurement | Somali | Immigrants from Northern Europe |
| Minimum | 53.8% | 42.9% |
| Maximum | 100.0% | 100.0% |
| Range | 46.2% | 57.1% |
| Mean | 87.4% | 86.2% |
| Median | 87.3% | 86.5% |
| Interquartile 25% (IQ1) | 85.4% | 83.8% |
| Interquartile 75% (IQ3) | 90.2% | 100.0% |
| Interquartile Range (IQR) | 4.8% | 16.2% |
| Standard Deviation (Sample) | 6.4% | 13.5% |
| Standard Deviation (Population) | 6.3% | 13.3% |
Similar Demographics by In Labor Force | Age 25-29
Demographics Similar to Somalis by In Labor Force | Age 25-29
In terms of in labor force | age 25-29, the demographic groups most similar to Somalis are Immigrants from Somalia (87.1%, a difference of 0.010%), Carpatho Rusyn (87.0%, a difference of 0.090%), Luxembourger (86.9%, a difference of 0.19%), Slovene (86.4%, a difference of 0.80%), and Immigrants from Bosnia and Herzegovina (86.3%, a difference of 0.93%).
| Demographics | Rating | Rank | In Labor Force | Age 25-29 |
| Tsimshian | 100.0 /100 | #1 | Exceptional 88.7% |
| Immigrants | Somalia | 100.0 /100 | #2 | Exceptional 87.1% |
| Somalis | 100.0 /100 | #3 | Exceptional 87.1% |
| Carpatho Rusyns | 100.0 /100 | #4 | Exceptional 87.0% |
| Luxembourgers | 100.0 /100 | #5 | Exceptional 86.9% |
| Slovenes | 100.0 /100 | #6 | Exceptional 86.4% |
| Immigrants | Bosnia and Herzegovina | 100.0 /100 | #7 | Exceptional 86.3% |
| Immigrants | Cabo Verde | 100.0 /100 | #8 | Exceptional 86.2% |
| Ethiopians | 100.0 /100 | #9 | Exceptional 86.2% |
| Liberians | 100.0 /100 | #10 | Exceptional 86.1% |
| Immigrants | Ethiopia | 100.0 /100 | #11 | Exceptional 86.1% |
| Immigrants | Lithuania | 100.0 /100 | #12 | Exceptional 86.1% |
| Norwegians | 100.0 /100 | #13 | Exceptional 86.1% |
| Latvians | 100.0 /100 | #14 | Exceptional 86.1% |
| Bolivians | 100.0 /100 | #15 | Exceptional 86.1% |
Demographics Similar to Immigrants from Northern Europe by In Labor Force | Age 25-29
In terms of in labor force | age 25-29, the demographic groups most similar to Immigrants from Northern Europe are Immigrants from Zimbabwe (85.2%, a difference of 0.020%), Okinawan (85.2%, a difference of 0.020%), Immigrants from Egypt (85.2%, a difference of 0.030%), Immigrants from Northern Africa (85.2%, a difference of 0.030%), and Immigrants from Europe (85.2%, a difference of 0.030%).
| Demographics | Rating | Rank | In Labor Force | Age 25-29 |
| Soviet Union | 98.5 /100 | #74 | Exceptional 85.3% |
| Brazilians | 98.3 /100 | #75 | Exceptional 85.3% |
| Germans | 98.1 /100 | #76 | Exceptional 85.3% |
| Immigrants | South Central Asia | 97.9 /100 | #77 | Exceptional 85.2% |
| Immigrants | Egypt | 97.7 /100 | #78 | Exceptional 85.2% |
| Immigrants | Northern Africa | 97.6 /100 | #79 | Exceptional 85.2% |
| Immigrants | Zimbabwe | 97.6 /100 | #80 | Exceptional 85.2% |
| Immigrants | Northern Europe | 97.2 /100 | #81 | Exceptional 85.2% |
| Okinawans | 97.0 /100 | #82 | Exceptional 85.2% |
| Immigrants | Europe | 96.8 /100 | #83 | Exceptional 85.2% |
| Immigrants | Eastern Europe | 96.8 /100 | #84 | Exceptional 85.2% |
| Immigrants | Africa | 96.7 /100 | #85 | Exceptional 85.2% |
| Ukrainians | 96.7 /100 | #86 | Exceptional 85.2% |
| French Canadians | 96.5 /100 | #87 | Exceptional 85.2% |
| Immigrants | Croatia | 96.4 /100 | #88 | Exceptional 85.2% |