Nepalese vs Liberian In Labor Force | Age 25-29
COMPARE
Nepalese
Liberian
In Labor Force | Age 25-29
In Labor Force | Age 25-29 Comparison
Nepalese
Liberians
82.9%
IN LABOR FORCE | AGE 25-29
0.0/ 100
METRIC RATING
294th/ 347
METRIC RANK
86.1%
IN LABOR FORCE | AGE 25-29
100.0/ 100
METRIC RATING
10th/ 347
METRIC RANK
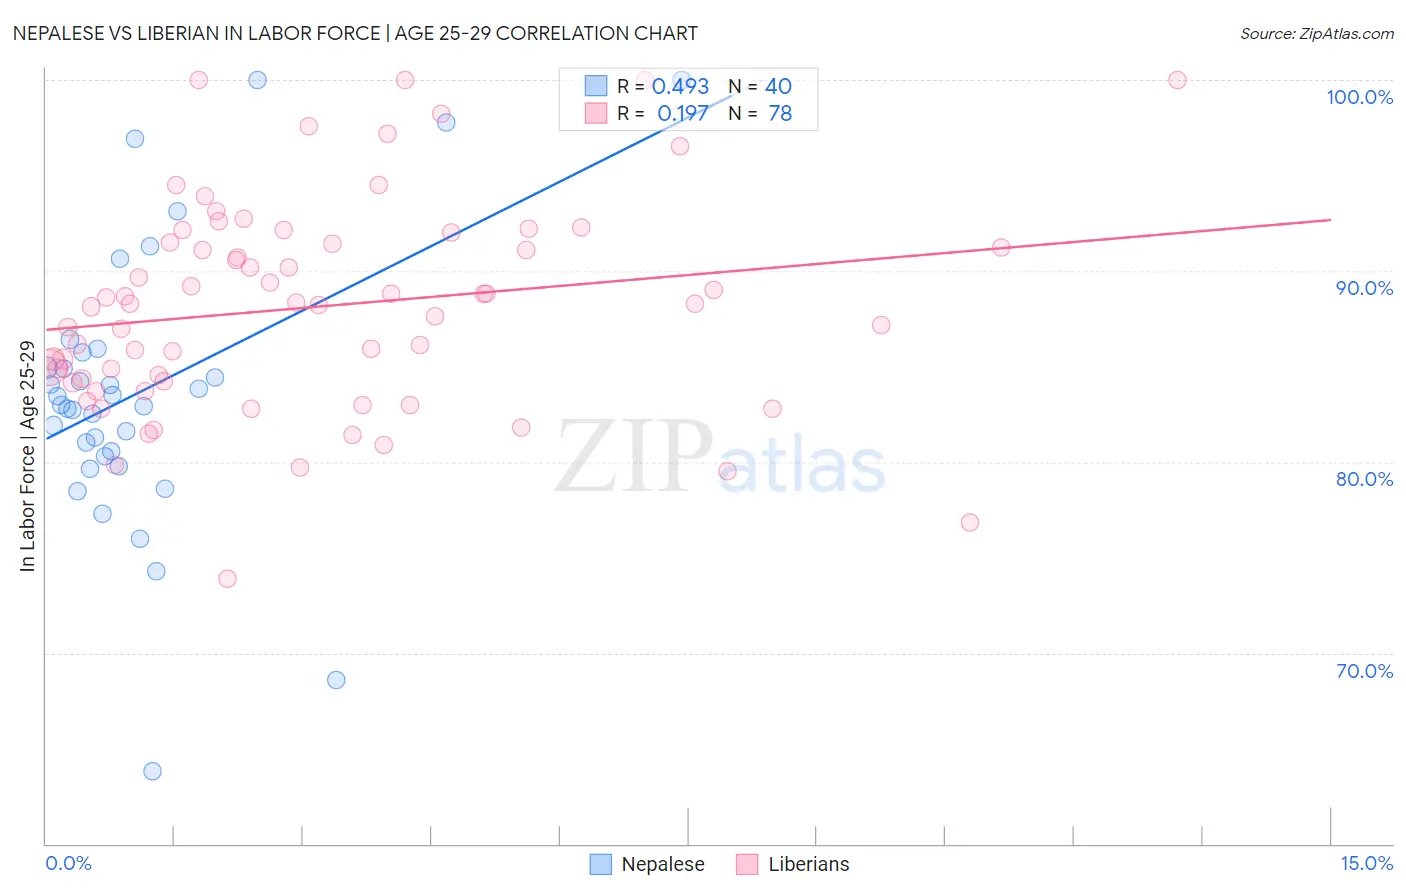
Nepalese vs Liberian In Labor Force | Age 25-29 Correlation Chart
The statistical analysis conducted on geographies consisting of 24,521,755 people shows a moderate positive correlation between the proportion of Nepalese and labor force participation rate among population between the ages 25 and 29 in the United States with a correlation coefficient (R) of 0.493 and weighted average of 82.9%. Similarly, the statistical analysis conducted on geographies consisting of 118,077,550 people shows a poor positive correlation between the proportion of Liberians and labor force participation rate among population between the ages 25 and 29 in the United States with a correlation coefficient (R) of 0.197 and weighted average of 86.1%, a difference of 3.9%.
In Labor Force | Age 25-29 Correlation Summary
| Measurement | Nepalese | Liberian |
| Minimum | 63.8% | 73.9% |
| Maximum | 100.0% | 100.0% |
| Range | 36.2% | 26.1% |
| Mean | 84.1% | 88.1% |
| Median | 83.2% | 88.3% |
| Interquartile 25% (IQ1) | 80.4% | 84.2% |
| Interquartile 75% (IQ3) | 85.8% | 91.5% |
| Interquartile Range (IQR) | 5.4% | 7.3% |
| Standard Deviation (Sample) | 7.7% | 5.5% |
| Standard Deviation (Population) | 7.6% | 5.5% |
Similar Demographics by In Labor Force | Age 25-29
Demographics Similar to Nepalese by In Labor Force | Age 25-29
In terms of in labor force | age 25-29, the demographic groups most similar to Nepalese are Immigrants from Latin America (82.9%, a difference of 0.0%), Chippewa (82.9%, a difference of 0.0%), Immigrants from Nicaragua (82.9%, a difference of 0.0%), Potawatomi (82.9%, a difference of 0.010%), and Native Hawaiian (82.9%, a difference of 0.020%).
| Demographics | Rating | Rank | In Labor Force | Age 25-29 |
| Guyanese | 0.0 /100 | #287 | Tragic 83.0% |
| Ottawa | 0.0 /100 | #288 | Tragic 83.0% |
| Immigrants | Micronesia | 0.0 /100 | #289 | Tragic 83.0% |
| Immigrants | Bangladesh | 0.0 /100 | #290 | Tragic 83.0% |
| Hawaiians | 0.0 /100 | #291 | Tragic 83.0% |
| Immigrants | Guyana | 0.0 /100 | #292 | Tragic 83.0% |
| Immigrants | Latin America | 0.0 /100 | #293 | Tragic 82.9% |
| Nepalese | 0.0 /100 | #294 | Tragic 82.9% |
| Chippewa | 0.0 /100 | #295 | Tragic 82.9% |
| Immigrants | Nicaragua | 0.0 /100 | #296 | Tragic 82.9% |
| Potawatomi | 0.0 /100 | #297 | Tragic 82.9% |
| Native Hawaiians | 0.0 /100 | #298 | Tragic 82.9% |
| Fijians | 0.0 /100 | #299 | Tragic 82.9% |
| Spanish American Indians | 0.0 /100 | #300 | Tragic 82.9% |
| Vietnamese | 0.0 /100 | #301 | Tragic 82.8% |
Demographics Similar to Liberians by In Labor Force | Age 25-29
In terms of in labor force | age 25-29, the demographic groups most similar to Liberians are Immigrants from Ethiopia (86.1%, a difference of 0.0%), Immigrants from Lithuania (86.1%, a difference of 0.010%), Norwegian (86.1%, a difference of 0.030%), Ethiopian (86.2%, a difference of 0.050%), and Latvian (86.1%, a difference of 0.060%).
| Demographics | Rating | Rank | In Labor Force | Age 25-29 |
| Somalis | 100.0 /100 | #3 | Exceptional 87.1% |
| Carpatho Rusyns | 100.0 /100 | #4 | Exceptional 87.0% |
| Luxembourgers | 100.0 /100 | #5 | Exceptional 86.9% |
| Slovenes | 100.0 /100 | #6 | Exceptional 86.4% |
| Immigrants | Bosnia and Herzegovina | 100.0 /100 | #7 | Exceptional 86.3% |
| Immigrants | Cabo Verde | 100.0 /100 | #8 | Exceptional 86.2% |
| Ethiopians | 100.0 /100 | #9 | Exceptional 86.2% |
| Liberians | 100.0 /100 | #10 | Exceptional 86.1% |
| Immigrants | Ethiopia | 100.0 /100 | #11 | Exceptional 86.1% |
| Immigrants | Lithuania | 100.0 /100 | #12 | Exceptional 86.1% |
| Norwegians | 100.0 /100 | #13 | Exceptional 86.1% |
| Latvians | 100.0 /100 | #14 | Exceptional 86.1% |
| Bolivians | 100.0 /100 | #15 | Exceptional 86.1% |
| Immigrants | Bolivia | 100.0 /100 | #16 | Exceptional 86.1% |
| Bermudans | 100.0 /100 | #17 | Exceptional 86.0% |