Immigrants from Morocco vs Immigrants from Northern Europe In Labor Force | Age 25-29
COMPARE
Immigrants from Morocco
Immigrants from Northern Europe
In Labor Force | Age 25-29
In Labor Force | Age 25-29 Comparison
Immigrants from Morocco
Immigrants from Northern Europe
85.5%
IN LABOR FORCE | AGE 25-29
99.5/ 100
METRIC RATING
59th/ 347
METRIC RANK
85.2%
IN LABOR FORCE | AGE 25-29
97.2/ 100
METRIC RATING
81st/ 347
METRIC RANK
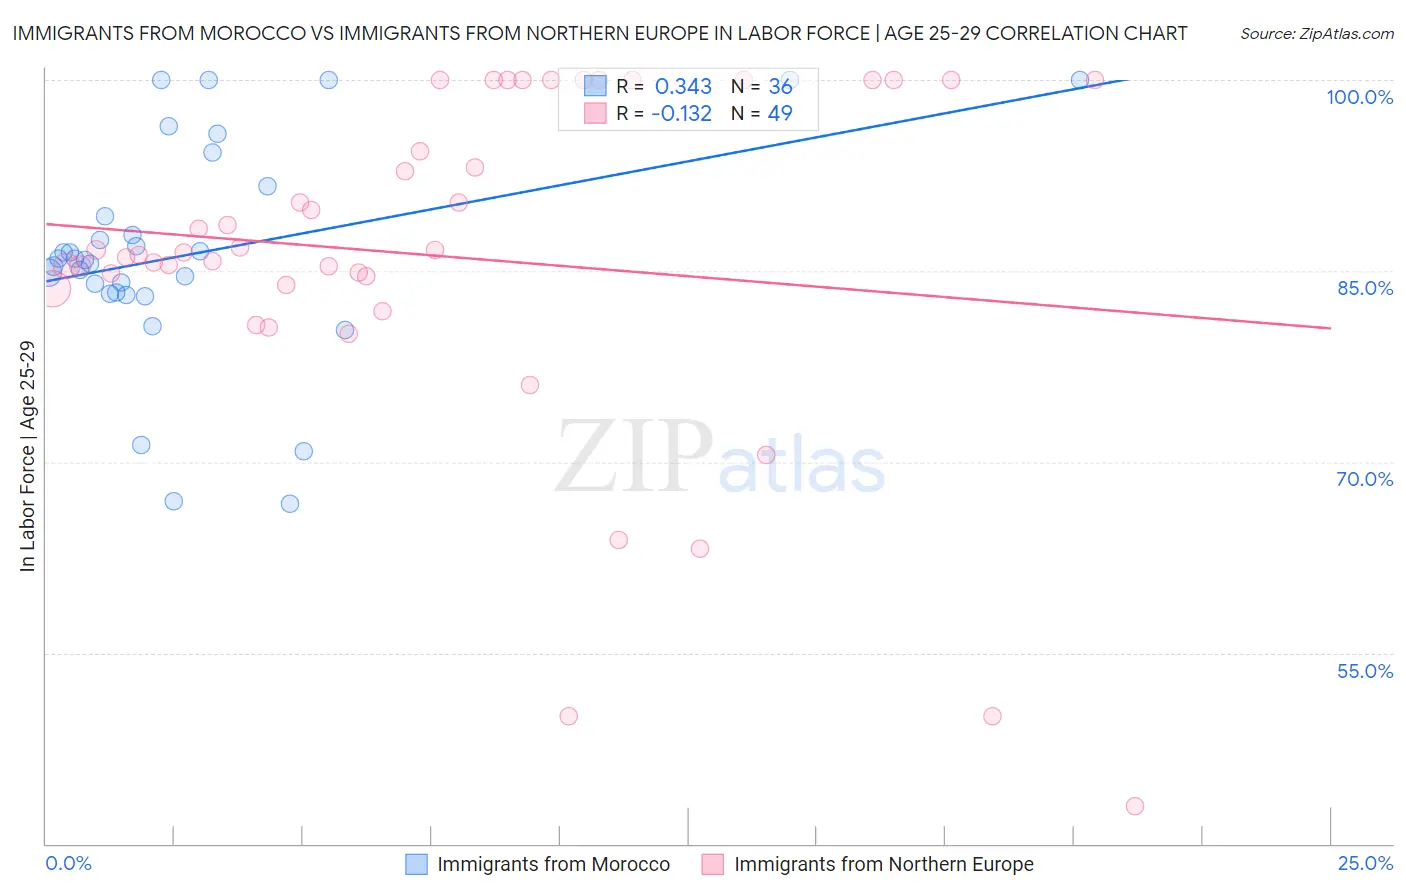
Immigrants from Morocco vs Immigrants from Northern Europe In Labor Force | Age 25-29 Correlation Chart
The statistical analysis conducted on geographies consisting of 178,899,306 people shows a mild positive correlation between the proportion of Immigrants from Morocco and labor force participation rate among population between the ages 25 and 29 in the United States with a correlation coefficient (R) of 0.343 and weighted average of 85.5%. Similarly, the statistical analysis conducted on geographies consisting of 476,832,999 people shows a poor negative correlation between the proportion of Immigrants from Northern Europe and labor force participation rate among population between the ages 25 and 29 in the United States with a correlation coefficient (R) of -0.132 and weighted average of 85.2%, a difference of 0.33%.
In Labor Force | Age 25-29 Correlation Summary
| Measurement | Immigrants from Morocco | Immigrants from Northern Europe |
| Minimum | 66.7% | 42.9% |
| Maximum | 100.0% | 100.0% |
| Range | 33.3% | 57.1% |
| Mean | 86.4% | 86.2% |
| Median | 85.9% | 86.5% |
| Interquartile 25% (IQ1) | 83.3% | 83.8% |
| Interquartile 75% (IQ3) | 90.5% | 100.0% |
| Interquartile Range (IQR) | 7.2% | 16.2% |
| Standard Deviation (Sample) | 8.6% | 13.5% |
| Standard Deviation (Population) | 8.5% | 13.3% |
Similar Demographics by In Labor Force | Age 25-29
Demographics Similar to Immigrants from Morocco by In Labor Force | Age 25-29
In terms of in labor force | age 25-29, the demographic groups most similar to Immigrants from Morocco are Estonian (85.5%, a difference of 0.010%), Greek (85.5%, a difference of 0.010%), Eastern European (85.5%, a difference of 0.020%), Thai (85.5%, a difference of 0.030%), and Serbian (85.5%, a difference of 0.030%).
| Demographics | Rating | Rank | In Labor Force | Age 25-29 |
| Immigrants | Poland | 99.7 /100 | #52 | Exceptional 85.6% |
| Belgians | 99.7 /100 | #53 | Exceptional 85.5% |
| Albanians | 99.7 /100 | #54 | Exceptional 85.5% |
| Immigrants | Brazil | 99.7 /100 | #55 | Exceptional 85.5% |
| Eastern Europeans | 99.6 /100 | #56 | Exceptional 85.5% |
| Estonians | 99.6 /100 | #57 | Exceptional 85.5% |
| Greeks | 99.6 /100 | #58 | Exceptional 85.5% |
| Immigrants | Morocco | 99.5 /100 | #59 | Exceptional 85.5% |
| Thais | 99.5 /100 | #60 | Exceptional 85.5% |
| Serbians | 99.5 /100 | #61 | Exceptional 85.5% |
| Taiwanese | 99.4 /100 | #62 | Exceptional 85.4% |
| Immigrants | Kenya | 99.4 /100 | #63 | Exceptional 85.4% |
| Immigrants | Italy | 99.3 /100 | #64 | Exceptional 85.4% |
| Immigrants | Czechoslovakia | 99.3 /100 | #65 | Exceptional 85.4% |
| Immigrants | Scotland | 99.3 /100 | #66 | Exceptional 85.4% |
Demographics Similar to Immigrants from Northern Europe by In Labor Force | Age 25-29
In terms of in labor force | age 25-29, the demographic groups most similar to Immigrants from Northern Europe are Immigrants from Zimbabwe (85.2%, a difference of 0.020%), Okinawan (85.2%, a difference of 0.020%), Immigrants from Egypt (85.2%, a difference of 0.030%), Immigrants from Northern Africa (85.2%, a difference of 0.030%), and Immigrants from Europe (85.2%, a difference of 0.030%).
| Demographics | Rating | Rank | In Labor Force | Age 25-29 |
| Soviet Union | 98.5 /100 | #74 | Exceptional 85.3% |
| Brazilians | 98.3 /100 | #75 | Exceptional 85.3% |
| Germans | 98.1 /100 | #76 | Exceptional 85.3% |
| Immigrants | South Central Asia | 97.9 /100 | #77 | Exceptional 85.2% |
| Immigrants | Egypt | 97.7 /100 | #78 | Exceptional 85.2% |
| Immigrants | Northern Africa | 97.6 /100 | #79 | Exceptional 85.2% |
| Immigrants | Zimbabwe | 97.6 /100 | #80 | Exceptional 85.2% |
| Immigrants | Northern Europe | 97.2 /100 | #81 | Exceptional 85.2% |
| Okinawans | 97.0 /100 | #82 | Exceptional 85.2% |
| Immigrants | Europe | 96.8 /100 | #83 | Exceptional 85.2% |
| Immigrants | Eastern Europe | 96.8 /100 | #84 | Exceptional 85.2% |
| Immigrants | Africa | 96.7 /100 | #85 | Exceptional 85.2% |
| Ukrainians | 96.7 /100 | #86 | Exceptional 85.2% |
| French Canadians | 96.5 /100 | #87 | Exceptional 85.2% |
| Immigrants | Croatia | 96.4 /100 | #88 | Exceptional 85.2% |