Nepalese vs Immigrants from Scotland In Labor Force | Age 25-29
COMPARE
Nepalese
Immigrants from Scotland
In Labor Force | Age 25-29
In Labor Force | Age 25-29 Comparison
Nepalese
Immigrants from Scotland
82.9%
IN LABOR FORCE | AGE 25-29
0.0/ 100
METRIC RATING
294th/ 347
METRIC RANK
85.4%
IN LABOR FORCE | AGE 25-29
99.3/ 100
METRIC RATING
66th/ 347
METRIC RANK
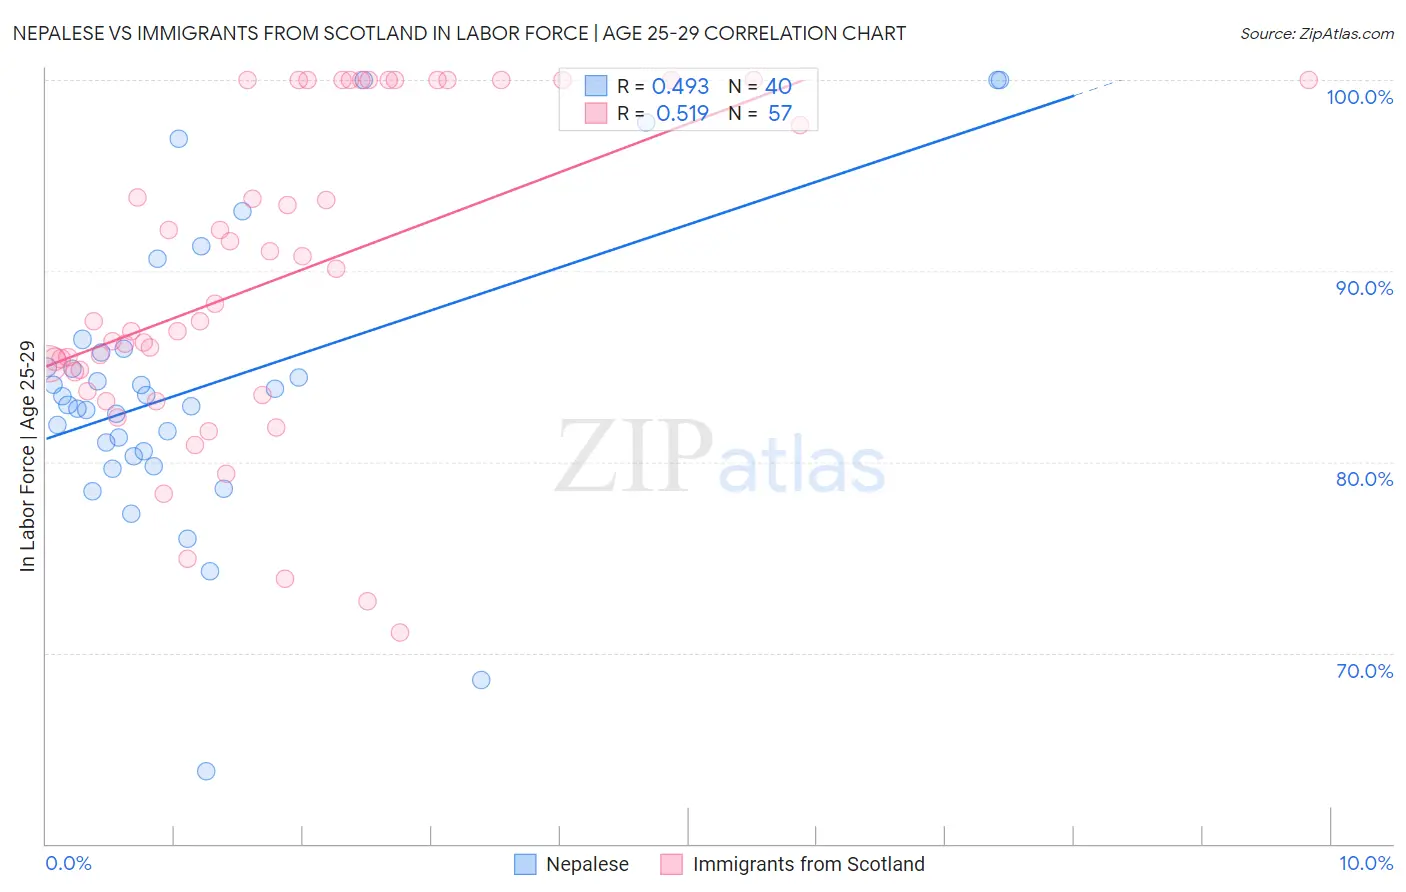
Nepalese vs Immigrants from Scotland In Labor Force | Age 25-29 Correlation Chart
The statistical analysis conducted on geographies consisting of 24,521,755 people shows a moderate positive correlation between the proportion of Nepalese and labor force participation rate among population between the ages 25 and 29 in the United States with a correlation coefficient (R) of 0.493 and weighted average of 82.9%. Similarly, the statistical analysis conducted on geographies consisting of 196,358,343 people shows a substantial positive correlation between the proportion of Immigrants from Scotland and labor force participation rate among population between the ages 25 and 29 in the United States with a correlation coefficient (R) of 0.519 and weighted average of 85.4%, a difference of 3.0%.
In Labor Force | Age 25-29 Correlation Summary
| Measurement | Nepalese | Immigrants from Scotland |
| Minimum | 63.8% | 71.0% |
| Maximum | 100.0% | 100.0% |
| Range | 36.2% | 29.0% |
| Mean | 84.1% | 89.6% |
| Median | 83.2% | 87.4% |
| Interquartile 25% (IQ1) | 80.4% | 84.2% |
| Interquartile 75% (IQ3) | 85.8% | 100.0% |
| Interquartile Range (IQR) | 5.4% | 15.8% |
| Standard Deviation (Sample) | 7.7% | 8.3% |
| Standard Deviation (Population) | 7.6% | 8.2% |
Similar Demographics by In Labor Force | Age 25-29
Demographics Similar to Nepalese by In Labor Force | Age 25-29
In terms of in labor force | age 25-29, the demographic groups most similar to Nepalese are Immigrants from Latin America (82.9%, a difference of 0.0%), Chippewa (82.9%, a difference of 0.0%), Immigrants from Nicaragua (82.9%, a difference of 0.0%), Potawatomi (82.9%, a difference of 0.010%), and Native Hawaiian (82.9%, a difference of 0.020%).
| Demographics | Rating | Rank | In Labor Force | Age 25-29 |
| Guyanese | 0.0 /100 | #287 | Tragic 83.0% |
| Ottawa | 0.0 /100 | #288 | Tragic 83.0% |
| Immigrants | Micronesia | 0.0 /100 | #289 | Tragic 83.0% |
| Immigrants | Bangladesh | 0.0 /100 | #290 | Tragic 83.0% |
| Hawaiians | 0.0 /100 | #291 | Tragic 83.0% |
| Immigrants | Guyana | 0.0 /100 | #292 | Tragic 83.0% |
| Immigrants | Latin America | 0.0 /100 | #293 | Tragic 82.9% |
| Nepalese | 0.0 /100 | #294 | Tragic 82.9% |
| Chippewa | 0.0 /100 | #295 | Tragic 82.9% |
| Immigrants | Nicaragua | 0.0 /100 | #296 | Tragic 82.9% |
| Potawatomi | 0.0 /100 | #297 | Tragic 82.9% |
| Native Hawaiians | 0.0 /100 | #298 | Tragic 82.9% |
| Fijians | 0.0 /100 | #299 | Tragic 82.9% |
| Spanish American Indians | 0.0 /100 | #300 | Tragic 82.9% |
| Vietnamese | 0.0 /100 | #301 | Tragic 82.8% |
Demographics Similar to Immigrants from Scotland by In Labor Force | Age 25-29
In terms of in labor force | age 25-29, the demographic groups most similar to Immigrants from Scotland are Immigrants from Italy (85.4%, a difference of 0.010%), Immigrants from Czechoslovakia (85.4%, a difference of 0.010%), Immigrants from Turkey (85.4%, a difference of 0.010%), Immigrants from Cameroon (85.4%, a difference of 0.020%), and Immigrants from Kenya (85.4%, a difference of 0.030%).
| Demographics | Rating | Rank | In Labor Force | Age 25-29 |
| Immigrants | Morocco | 99.5 /100 | #59 | Exceptional 85.5% |
| Thais | 99.5 /100 | #60 | Exceptional 85.5% |
| Serbians | 99.5 /100 | #61 | Exceptional 85.5% |
| Taiwanese | 99.4 /100 | #62 | Exceptional 85.4% |
| Immigrants | Kenya | 99.4 /100 | #63 | Exceptional 85.4% |
| Immigrants | Italy | 99.3 /100 | #64 | Exceptional 85.4% |
| Immigrants | Czechoslovakia | 99.3 /100 | #65 | Exceptional 85.4% |
| Immigrants | Scotland | 99.3 /100 | #66 | Exceptional 85.4% |
| Immigrants | Turkey | 99.2 /100 | #67 | Exceptional 85.4% |
| Immigrants | Cameroon | 99.2 /100 | #68 | Exceptional 85.4% |
| Menominee | 99.1 /100 | #69 | Exceptional 85.4% |
| Immigrants | Sweden | 99.1 /100 | #70 | Exceptional 85.4% |
| Kenyans | 99.0 /100 | #71 | Exceptional 85.4% |
| Immigrants | Australia | 98.9 /100 | #72 | Exceptional 85.3% |
| Russians | 98.8 /100 | #73 | Exceptional 85.3% |