Nepalese vs British In Labor Force | Age 25-29
COMPARE
Nepalese
British
In Labor Force | Age 25-29
In Labor Force | Age 25-29 Comparison
Nepalese
British
82.9%
IN LABOR FORCE | AGE 25-29
0.0/ 100
METRIC RATING
294th/ 347
METRIC RANK
84.7%
IN LABOR FORCE | AGE 25-29
60.4/ 100
METRIC RATING
157th/ 347
METRIC RANK
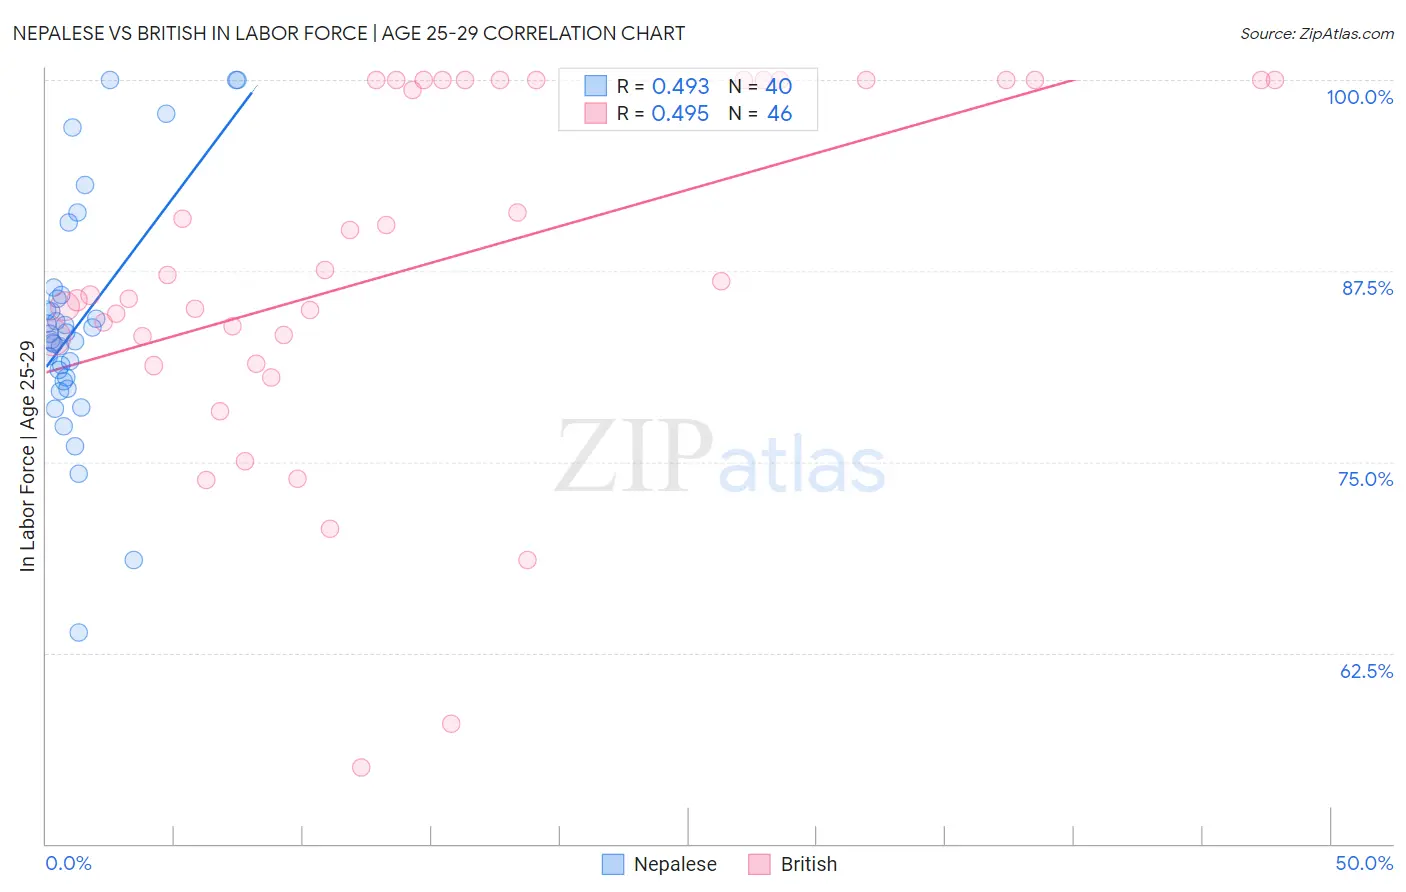
Nepalese vs British In Labor Force | Age 25-29 Correlation Chart
The statistical analysis conducted on geographies consisting of 24,521,755 people shows a moderate positive correlation between the proportion of Nepalese and labor force participation rate among population between the ages 25 and 29 in the United States with a correlation coefficient (R) of 0.493 and weighted average of 82.9%. Similarly, the statistical analysis conducted on geographies consisting of 530,868,549 people shows a moderate positive correlation between the proportion of British and labor force participation rate among population between the ages 25 and 29 in the United States with a correlation coefficient (R) of 0.495 and weighted average of 84.7%, a difference of 2.2%.
In Labor Force | Age 25-29 Correlation Summary
| Measurement | Nepalese | British |
| Minimum | 63.8% | 55.0% |
| Maximum | 100.0% | 100.0% |
| Range | 36.2% | 45.0% |
| Mean | 84.1% | 87.7% |
| Median | 83.2% | 86.4% |
| Interquartile 25% (IQ1) | 80.4% | 83.1% |
| Interquartile 75% (IQ3) | 85.8% | 100.0% |
| Interquartile Range (IQR) | 5.4% | 16.9% |
| Standard Deviation (Sample) | 7.7% | 11.5% |
| Standard Deviation (Population) | 7.6% | 11.4% |
Similar Demographics by In Labor Force | Age 25-29
Demographics Similar to Nepalese by In Labor Force | Age 25-29
In terms of in labor force | age 25-29, the demographic groups most similar to Nepalese are Immigrants from Latin America (82.9%, a difference of 0.0%), Chippewa (82.9%, a difference of 0.0%), Immigrants from Nicaragua (82.9%, a difference of 0.0%), Potawatomi (82.9%, a difference of 0.010%), and Native Hawaiian (82.9%, a difference of 0.020%).
| Demographics | Rating | Rank | In Labor Force | Age 25-29 |
| Guyanese | 0.0 /100 | #287 | Tragic 83.0% |
| Ottawa | 0.0 /100 | #288 | Tragic 83.0% |
| Immigrants | Micronesia | 0.0 /100 | #289 | Tragic 83.0% |
| Immigrants | Bangladesh | 0.0 /100 | #290 | Tragic 83.0% |
| Hawaiians | 0.0 /100 | #291 | Tragic 83.0% |
| Immigrants | Guyana | 0.0 /100 | #292 | Tragic 83.0% |
| Immigrants | Latin America | 0.0 /100 | #293 | Tragic 82.9% |
| Nepalese | 0.0 /100 | #294 | Tragic 82.9% |
| Chippewa | 0.0 /100 | #295 | Tragic 82.9% |
| Immigrants | Nicaragua | 0.0 /100 | #296 | Tragic 82.9% |
| Potawatomi | 0.0 /100 | #297 | Tragic 82.9% |
| Native Hawaiians | 0.0 /100 | #298 | Tragic 82.9% |
| Fijians | 0.0 /100 | #299 | Tragic 82.9% |
| Spanish American Indians | 0.0 /100 | #300 | Tragic 82.9% |
| Vietnamese | 0.0 /100 | #301 | Tragic 82.8% |
Demographics Similar to British by In Labor Force | Age 25-29
In terms of in labor force | age 25-29, the demographic groups most similar to British are French (84.7%, a difference of 0.0%), Immigrants from Ghana (84.7%, a difference of 0.0%), Immigrants from Western Africa (84.7%, a difference of 0.0%), Immigrants from Taiwan (84.7%, a difference of 0.010%), and Immigrants from Sri Lanka (84.7%, a difference of 0.010%).
| Demographics | Rating | Rank | In Labor Force | Age 25-29 |
| Swiss | 64.7 /100 | #150 | Good 84.7% |
| Colombians | 62.8 /100 | #151 | Good 84.7% |
| Immigrants | Pakistan | 62.7 /100 | #152 | Good 84.7% |
| Immigrants | Taiwan | 62.2 /100 | #153 | Good 84.7% |
| Immigrants | Sri Lanka | 61.7 /100 | #154 | Good 84.7% |
| Indians (Asian) | 61.6 /100 | #155 | Good 84.7% |
| French | 61.0 /100 | #156 | Good 84.7% |
| British | 60.4 /100 | #157 | Good 84.7% |
| Immigrants | Ghana | 60.2 /100 | #158 | Good 84.7% |
| Immigrants | Western Africa | 60.1 /100 | #159 | Good 84.7% |
| Immigrants | Peru | 58.6 /100 | #160 | Average 84.7% |
| Canadians | 58.5 /100 | #161 | Average 84.7% |
| Immigrants | Colombia | 58.3 /100 | #162 | Average 84.7% |
| Argentineans | 57.9 /100 | #163 | Average 84.7% |
| Ghanaians | 57.6 /100 | #164 | Average 84.7% |