Creek vs Immigrants from Northern Europe In Labor Force | Age 25-29
COMPARE
Creek
Immigrants from Northern Europe
In Labor Force | Age 25-29
In Labor Force | Age 25-29 Comparison
Creek
Immigrants from Northern Europe
80.7%
IN LABOR FORCE | AGE 25-29
0.0/ 100
METRIC RATING
328th/ 347
METRIC RANK
85.2%
IN LABOR FORCE | AGE 25-29
97.2/ 100
METRIC RATING
81st/ 347
METRIC RANK
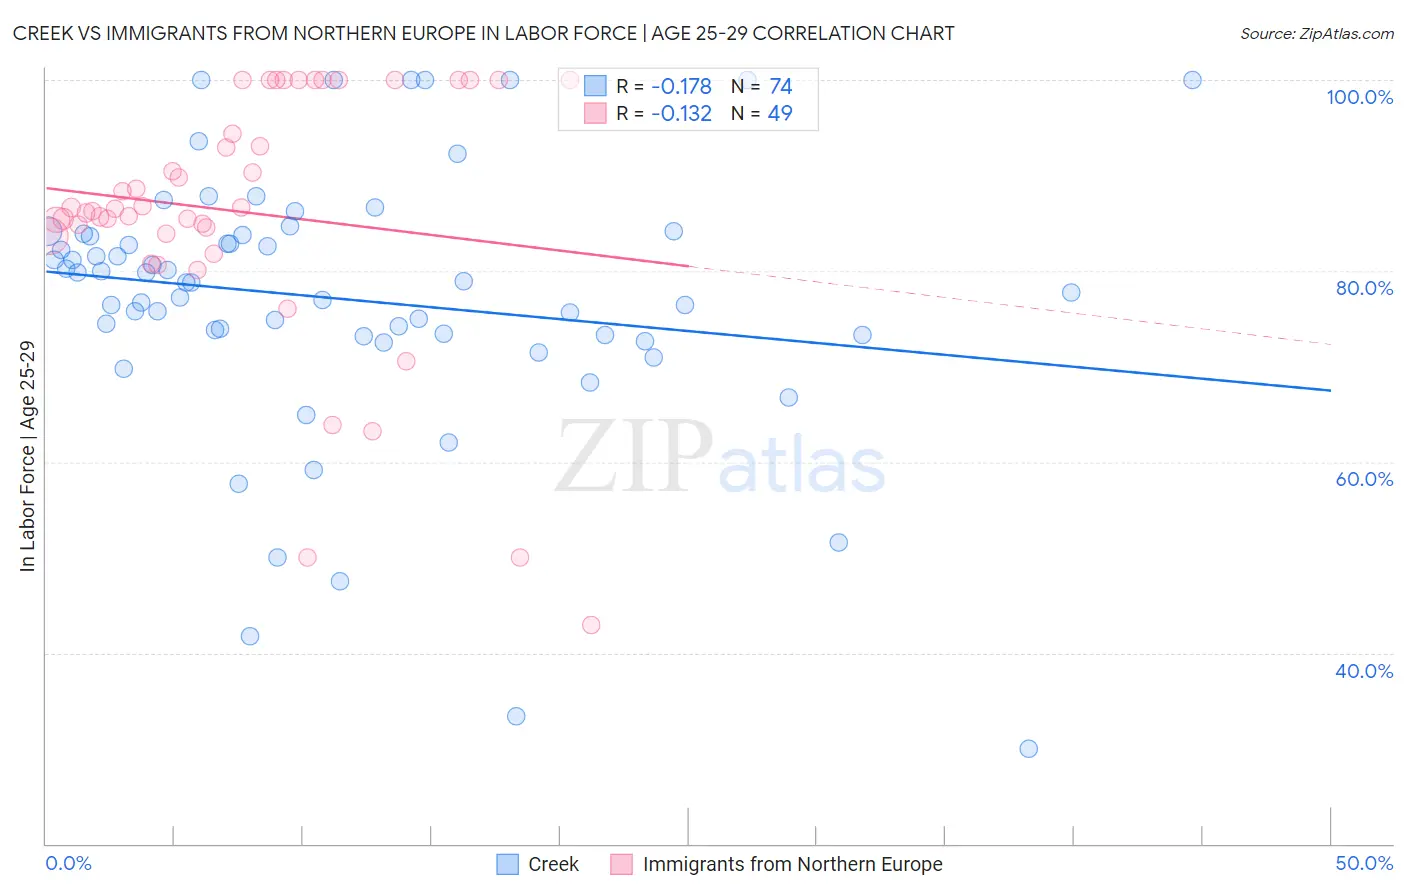
Creek vs Immigrants from Northern Europe In Labor Force | Age 25-29 Correlation Chart
The statistical analysis conducted on geographies consisting of 178,425,727 people shows a poor negative correlation between the proportion of Creek and labor force participation rate among population between the ages 25 and 29 in the United States with a correlation coefficient (R) of -0.178 and weighted average of 80.7%. Similarly, the statistical analysis conducted on geographies consisting of 476,832,999 people shows a poor negative correlation between the proportion of Immigrants from Northern Europe and labor force participation rate among population between the ages 25 and 29 in the United States with a correlation coefficient (R) of -0.132 and weighted average of 85.2%, a difference of 5.6%.
In Labor Force | Age 25-29 Correlation Summary
| Measurement | Creek | Immigrants from Northern Europe |
| Minimum | 30.0% | 42.9% |
| Maximum | 100.0% | 100.0% |
| Range | 70.0% | 57.1% |
| Mean | 77.0% | 86.2% |
| Median | 78.8% | 86.5% |
| Interquartile 25% (IQ1) | 73.3% | 83.8% |
| Interquartile 75% (IQ3) | 83.8% | 100.0% |
| Interquartile Range (IQR) | 10.5% | 16.2% |
| Standard Deviation (Sample) | 14.1% | 13.5% |
| Standard Deviation (Population) | 14.0% | 13.3% |
Similar Demographics by In Labor Force | Age 25-29
Demographics Similar to Creek by In Labor Force | Age 25-29
In terms of in labor force | age 25-29, the demographic groups most similar to Creek are Yakama (80.6%, a difference of 0.11%), Ute (80.8%, a difference of 0.15%), Puerto Rican (80.4%, a difference of 0.34%), Choctaw (81.0%, a difference of 0.35%), and Cheyenne (80.3%, a difference of 0.48%).
| Demographics | Rating | Rank | In Labor Force | Age 25-29 |
| Shoshone | 0.0 /100 | #321 | Tragic 81.6% |
| Kiowa | 0.0 /100 | #322 | Tragic 81.6% |
| Alaska Natives | 0.0 /100 | #323 | Tragic 81.6% |
| Houma | 0.0 /100 | #324 | Tragic 81.2% |
| Dutch West Indians | 0.0 /100 | #325 | Tragic 81.1% |
| Choctaw | 0.0 /100 | #326 | Tragic 81.0% |
| Ute | 0.0 /100 | #327 | Tragic 80.8% |
| Creek | 0.0 /100 | #328 | Tragic 80.7% |
| Yakama | 0.0 /100 | #329 | Tragic 80.6% |
| Puerto Ricans | 0.0 /100 | #330 | Tragic 80.4% |
| Cheyenne | 0.0 /100 | #331 | Tragic 80.3% |
| Inupiat | 0.0 /100 | #332 | Tragic 79.8% |
| Sioux | 0.0 /100 | #333 | Tragic 79.7% |
| Yuman | 0.0 /100 | #334 | Tragic 79.3% |
| Natives/Alaskans | 0.0 /100 | #335 | Tragic 79.3% |
Demographics Similar to Immigrants from Northern Europe by In Labor Force | Age 25-29
In terms of in labor force | age 25-29, the demographic groups most similar to Immigrants from Northern Europe are Immigrants from Zimbabwe (85.2%, a difference of 0.020%), Okinawan (85.2%, a difference of 0.020%), Immigrants from Egypt (85.2%, a difference of 0.030%), Immigrants from Northern Africa (85.2%, a difference of 0.030%), and Immigrants from Europe (85.2%, a difference of 0.030%).
| Demographics | Rating | Rank | In Labor Force | Age 25-29 |
| Soviet Union | 98.5 /100 | #74 | Exceptional 85.3% |
| Brazilians | 98.3 /100 | #75 | Exceptional 85.3% |
| Germans | 98.1 /100 | #76 | Exceptional 85.3% |
| Immigrants | South Central Asia | 97.9 /100 | #77 | Exceptional 85.2% |
| Immigrants | Egypt | 97.7 /100 | #78 | Exceptional 85.2% |
| Immigrants | Northern Africa | 97.6 /100 | #79 | Exceptional 85.2% |
| Immigrants | Zimbabwe | 97.6 /100 | #80 | Exceptional 85.2% |
| Immigrants | Northern Europe | 97.2 /100 | #81 | Exceptional 85.2% |
| Okinawans | 97.0 /100 | #82 | Exceptional 85.2% |
| Immigrants | Europe | 96.8 /100 | #83 | Exceptional 85.2% |
| Immigrants | Eastern Europe | 96.8 /100 | #84 | Exceptional 85.2% |
| Immigrants | Africa | 96.7 /100 | #85 | Exceptional 85.2% |
| Ukrainians | 96.7 /100 | #86 | Exceptional 85.2% |
| French Canadians | 96.5 /100 | #87 | Exceptional 85.2% |
| Immigrants | Croatia | 96.4 /100 | #88 | Exceptional 85.2% |