Nepalese vs Basque In Labor Force | Age 25-29
COMPARE
Nepalese
Basque
In Labor Force | Age 25-29
In Labor Force | Age 25-29 Comparison
Nepalese
Basques
82.9%
IN LABOR FORCE | AGE 25-29
0.0/ 100
METRIC RATING
294th/ 347
METRIC RANK
83.4%
IN LABOR FORCE | AGE 25-29
0.0/ 100
METRIC RATING
270th/ 347
METRIC RANK
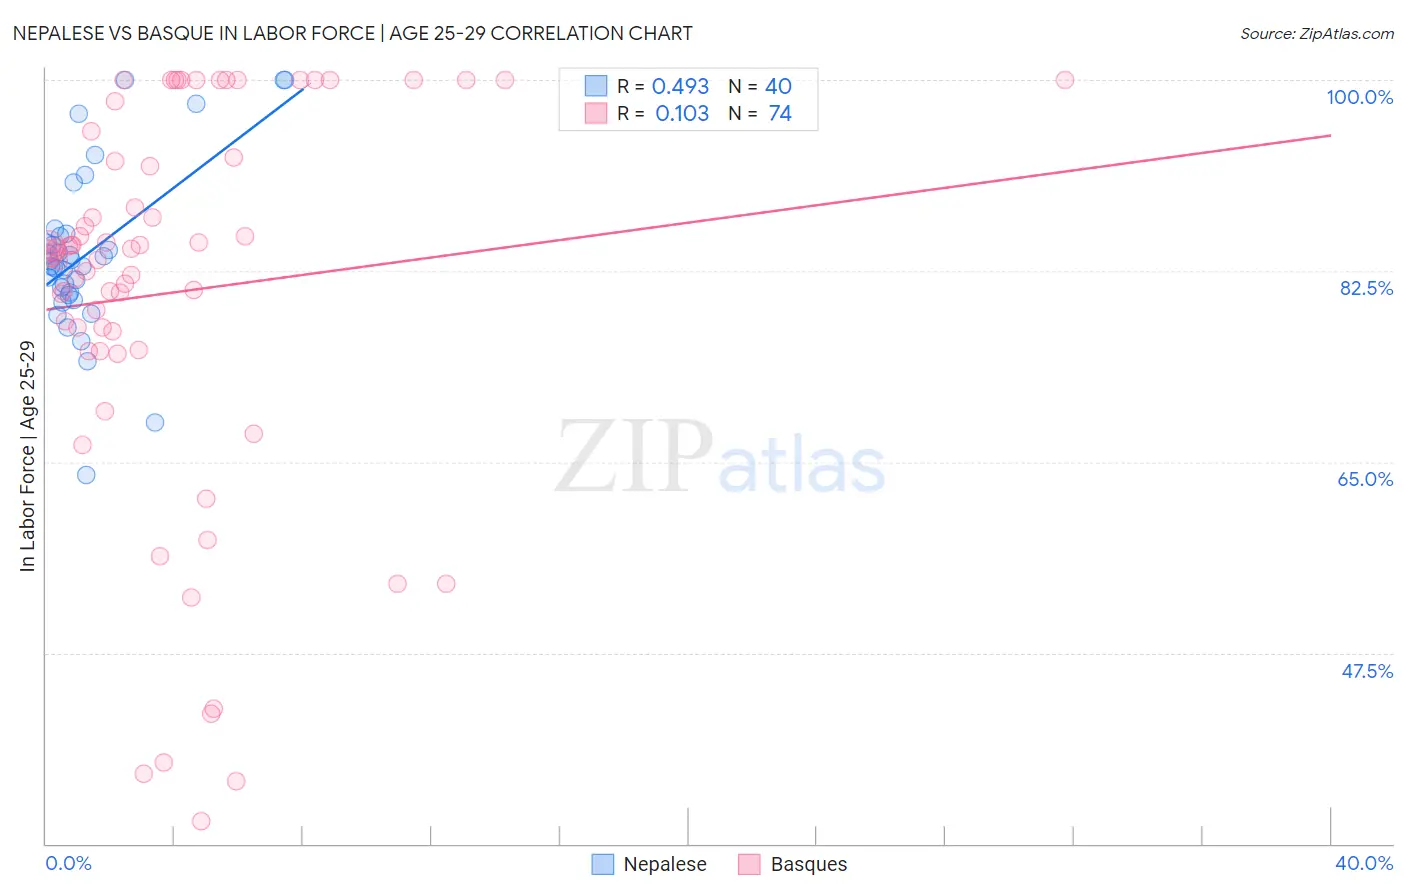
Nepalese vs Basque In Labor Force | Age 25-29 Correlation Chart
The statistical analysis conducted on geographies consisting of 24,521,755 people shows a moderate positive correlation between the proportion of Nepalese and labor force participation rate among population between the ages 25 and 29 in the United States with a correlation coefficient (R) of 0.493 and weighted average of 82.9%. Similarly, the statistical analysis conducted on geographies consisting of 165,753,435 people shows a poor positive correlation between the proportion of Basques and labor force participation rate among population between the ages 25 and 29 in the United States with a correlation coefficient (R) of 0.103 and weighted average of 83.4%, a difference of 0.58%.
In Labor Force | Age 25-29 Correlation Summary
| Measurement | Nepalese | Basque |
| Minimum | 63.8% | 32.1% |
| Maximum | 100.0% | 100.0% |
| Range | 36.2% | 67.9% |
| Mean | 84.1% | 80.5% |
| Median | 83.2% | 84.3% |
| Interquartile 25% (IQ1) | 80.4% | 75.3% |
| Interquartile 75% (IQ3) | 85.8% | 92.9% |
| Interquartile Range (IQR) | 5.4% | 17.6% |
| Standard Deviation (Sample) | 7.7% | 17.7% |
| Standard Deviation (Population) | 7.6% | 17.6% |
Similar Demographics by In Labor Force | Age 25-29
Demographics Similar to Nepalese by In Labor Force | Age 25-29
In terms of in labor force | age 25-29, the demographic groups most similar to Nepalese are Immigrants from Latin America (82.9%, a difference of 0.0%), Chippewa (82.9%, a difference of 0.0%), Immigrants from Nicaragua (82.9%, a difference of 0.0%), Potawatomi (82.9%, a difference of 0.010%), and Native Hawaiian (82.9%, a difference of 0.020%).
| Demographics | Rating | Rank | In Labor Force | Age 25-29 |
| Guyanese | 0.0 /100 | #287 | Tragic 83.0% |
| Ottawa | 0.0 /100 | #288 | Tragic 83.0% |
| Immigrants | Micronesia | 0.0 /100 | #289 | Tragic 83.0% |
| Immigrants | Bangladesh | 0.0 /100 | #290 | Tragic 83.0% |
| Hawaiians | 0.0 /100 | #291 | Tragic 83.0% |
| Immigrants | Guyana | 0.0 /100 | #292 | Tragic 83.0% |
| Immigrants | Latin America | 0.0 /100 | #293 | Tragic 82.9% |
| Nepalese | 0.0 /100 | #294 | Tragic 82.9% |
| Chippewa | 0.0 /100 | #295 | Tragic 82.9% |
| Immigrants | Nicaragua | 0.0 /100 | #296 | Tragic 82.9% |
| Potawatomi | 0.0 /100 | #297 | Tragic 82.9% |
| Native Hawaiians | 0.0 /100 | #298 | Tragic 82.9% |
| Fijians | 0.0 /100 | #299 | Tragic 82.9% |
| Spanish American Indians | 0.0 /100 | #300 | Tragic 82.9% |
| Vietnamese | 0.0 /100 | #301 | Tragic 82.8% |
Demographics Similar to Basques by In Labor Force | Age 25-29
In terms of in labor force | age 25-29, the demographic groups most similar to Basques are Immigrants from Barbados (83.4%, a difference of 0.010%), Spanish American (83.4%, a difference of 0.020%), Immigrants from Lebanon (83.4%, a difference of 0.020%), Honduran (83.4%, a difference of 0.020%), and Aleut (83.4%, a difference of 0.040%).
| Demographics | Rating | Rank | In Labor Force | Age 25-29 |
| West Indians | 0.1 /100 | #263 | Tragic 83.5% |
| Puget Sound Salish | 0.1 /100 | #264 | Tragic 83.5% |
| Cubans | 0.1 /100 | #265 | Tragic 83.5% |
| Aleuts | 0.0 /100 | #266 | Tragic 83.4% |
| Spanish Americans | 0.0 /100 | #267 | Tragic 83.4% |
| Immigrants | Lebanon | 0.0 /100 | #268 | Tragic 83.4% |
| Immigrants | Barbados | 0.0 /100 | #269 | Tragic 83.4% |
| Basques | 0.0 /100 | #270 | Tragic 83.4% |
| Hondurans | 0.0 /100 | #271 | Tragic 83.4% |
| Immigrants | Caribbean | 0.0 /100 | #272 | Tragic 83.4% |
| Immigrants | Dominica | 0.0 /100 | #273 | Tragic 83.4% |
| Marshallese | 0.0 /100 | #274 | Tragic 83.3% |
| Samoans | 0.0 /100 | #275 | Tragic 83.3% |
| Immigrants | Honduras | 0.0 /100 | #276 | Tragic 83.3% |
| Africans | 0.0 /100 | #277 | Tragic 83.2% |