Navajo vs Hispanic or Latino In Labor Force | Age 45-54
COMPARE
Navajo
Hispanic or Latino
In Labor Force | Age 45-54
In Labor Force | Age 45-54 Comparison
Navajo
Hispanics or Latinos
72.8%
IN LABOR FORCE | AGE 45-54
0.0/ 100
METRIC RATING
347th/ 347
METRIC RANK
80.1%
IN LABOR FORCE | AGE 45-54
0.0/ 100
METRIC RATING
304th/ 347
METRIC RANK
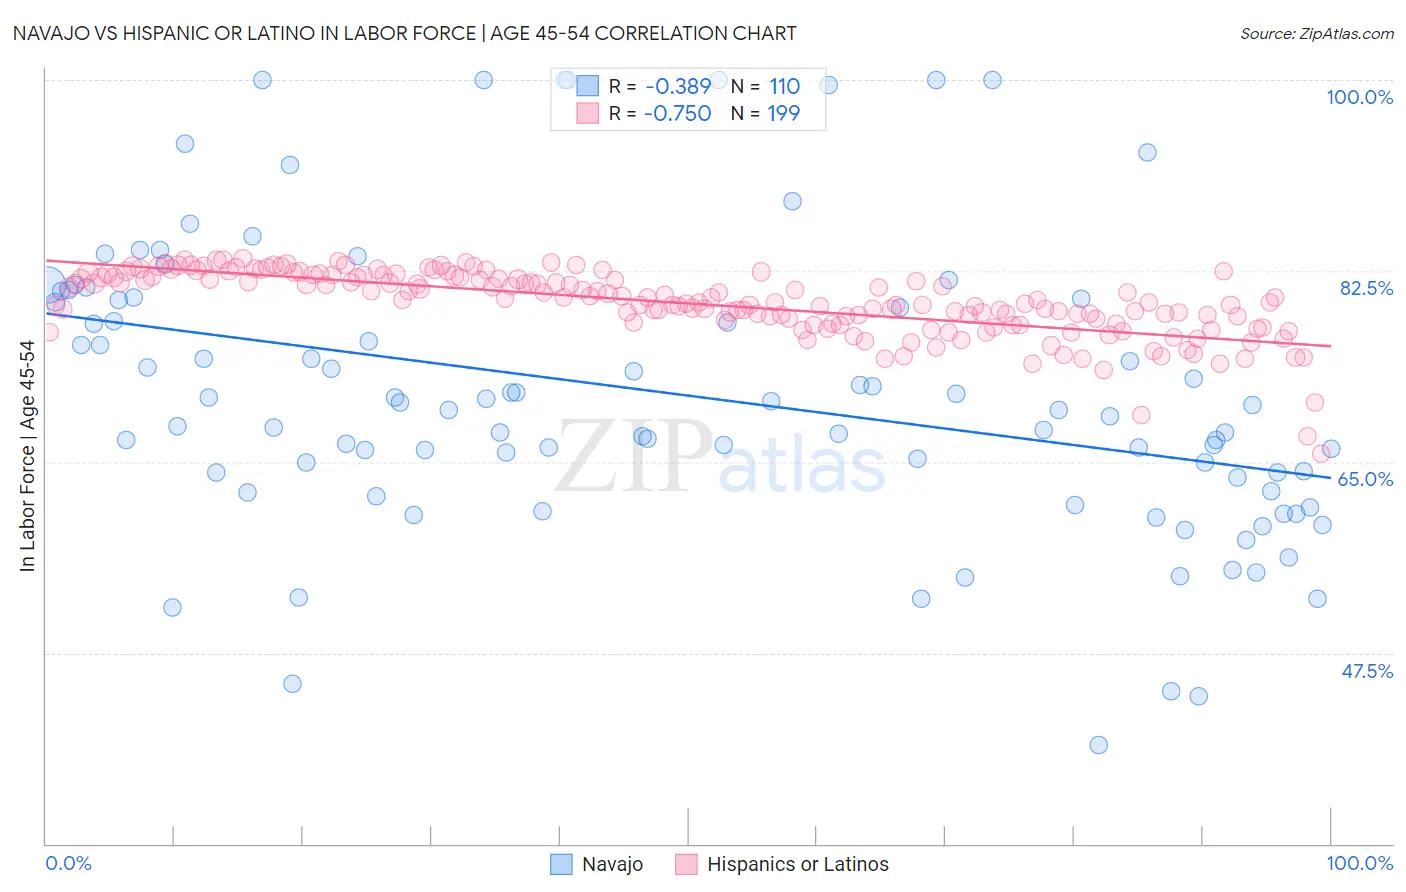
Navajo vs Hispanic or Latino In Labor Force | Age 45-54 Correlation Chart
The statistical analysis conducted on geographies consisting of 224,749,345 people shows a mild negative correlation between the proportion of Navajo and labor force participation rate among population between the ages 45 and 54 in the United States with a correlation coefficient (R) of -0.389 and weighted average of 72.8%. Similarly, the statistical analysis conducted on geographies consisting of 576,352,392 people shows a strong negative correlation between the proportion of Hispanics or Latinos and labor force participation rate among population between the ages 45 and 54 in the United States with a correlation coefficient (R) of -0.750 and weighted average of 80.1%, a difference of 10.0%.
In Labor Force | Age 45-54 Correlation Summary
| Measurement | Navajo | Hispanic or Latino |
| Minimum | 39.0% | 65.8% |
| Maximum | 100.0% | 83.7% |
| Range | 61.0% | 17.9% |
| Mean | 71.2% | 79.5% |
| Median | 69.7% | 79.8% |
| Interquartile 25% (IQ1) | 63.6% | 77.8% |
| Interquartile 75% (IQ3) | 79.9% | 81.9% |
| Interquartile Range (IQR) | 16.3% | 4.1% |
| Standard Deviation (Sample) | 13.3% | 3.0% |
| Standard Deviation (Population) | 13.2% | 3.0% |
Similar Demographics by In Labor Force | Age 45-54
Demographics Similar to Navajo by In Labor Force | Age 45-54
In terms of in labor force | age 45-54, the demographic groups most similar to Navajo are Pima (72.8%, a difference of 0.050%), Houma (74.1%, a difference of 1.8%), Immigrants from Yemen (74.4%, a difference of 2.2%), Hopi (75.0%, a difference of 3.0%), and Tohono O'odham (75.1%, a difference of 3.2%).
| Demographics | Rating | Rank | In Labor Force | Age 45-54 |
| Natives/Alaskans | 0.0 /100 | #333 | Tragic 77.1% |
| Apache | 0.0 /100 | #334 | Tragic 77.1% |
| Arapaho | 0.0 /100 | #335 | Tragic 77.1% |
| Paiute | 0.0 /100 | #336 | Tragic 76.7% |
| Ute | 0.0 /100 | #337 | Tragic 76.6% |
| Yuman | 0.0 /100 | #338 | Tragic 76.3% |
| Puerto Ricans | 0.0 /100 | #339 | Tragic 75.9% |
| Lumbee | 0.0 /100 | #340 | Tragic 75.6% |
| Pueblo | 0.0 /100 | #341 | Tragic 75.5% |
| Tohono O'odham | 0.0 /100 | #342 | Tragic 75.1% |
| Hopi | 0.0 /100 | #343 | Tragic 75.0% |
| Immigrants | Yemen | 0.0 /100 | #344 | Tragic 74.4% |
| Houma | 0.0 /100 | #345 | Tragic 74.1% |
| Pima | 0.0 /100 | #346 | Tragic 72.8% |
| Navajo | 0.0 /100 | #347 | Tragic 72.8% |
Demographics Similar to Hispanics or Latinos by In Labor Force | Age 45-54
In terms of in labor force | age 45-54, the demographic groups most similar to Hispanics or Latinos are Immigrants from Dominican Republic (80.1%, a difference of 0.010%), Immigrants from the Azores (80.1%, a difference of 0.020%), Spanish American (80.1%, a difference of 0.050%), Immigrants from Central America (80.2%, a difference of 0.090%), and Blackfeet (80.0%, a difference of 0.12%).
| Demographics | Rating | Rank | In Labor Force | Age 45-54 |
| Americans | 0.0 /100 | #297 | Tragic 80.4% |
| Marshallese | 0.0 /100 | #298 | Tragic 80.3% |
| Dominicans | 0.0 /100 | #299 | Tragic 80.3% |
| Fijians | 0.0 /100 | #300 | Tragic 80.2% |
| Spanish American Indians | 0.0 /100 | #301 | Tragic 80.2% |
| Immigrants | Central America | 0.0 /100 | #302 | Tragic 80.2% |
| Immigrants | Azores | 0.0 /100 | #303 | Tragic 80.1% |
| Hispanics or Latinos | 0.0 /100 | #304 | Tragic 80.1% |
| Immigrants | Dominican Republic | 0.0 /100 | #305 | Tragic 80.1% |
| Spanish Americans | 0.0 /100 | #306 | Tragic 80.1% |
| Blackfeet | 0.0 /100 | #307 | Tragic 80.0% |
| Central American Indians | 0.0 /100 | #308 | Tragic 80.0% |
| Potawatomi | 0.0 /100 | #309 | Tragic 80.0% |
| Inupiat | 0.0 /100 | #310 | Tragic 79.9% |
| Mexicans | 0.0 /100 | #311 | Tragic 79.8% |