Spanish vs Hispanic or Latino In Labor Force | Age 45-54
COMPARE
Spanish
Hispanic or Latino
In Labor Force | Age 45-54
In Labor Force | Age 45-54 Comparison
Spanish
Hispanics or Latinos
81.3%
IN LABOR FORCE | AGE 45-54
0.0/ 100
METRIC RATING
272nd/ 347
METRIC RANK
80.1%
IN LABOR FORCE | AGE 45-54
0.0/ 100
METRIC RATING
304th/ 347
METRIC RANK
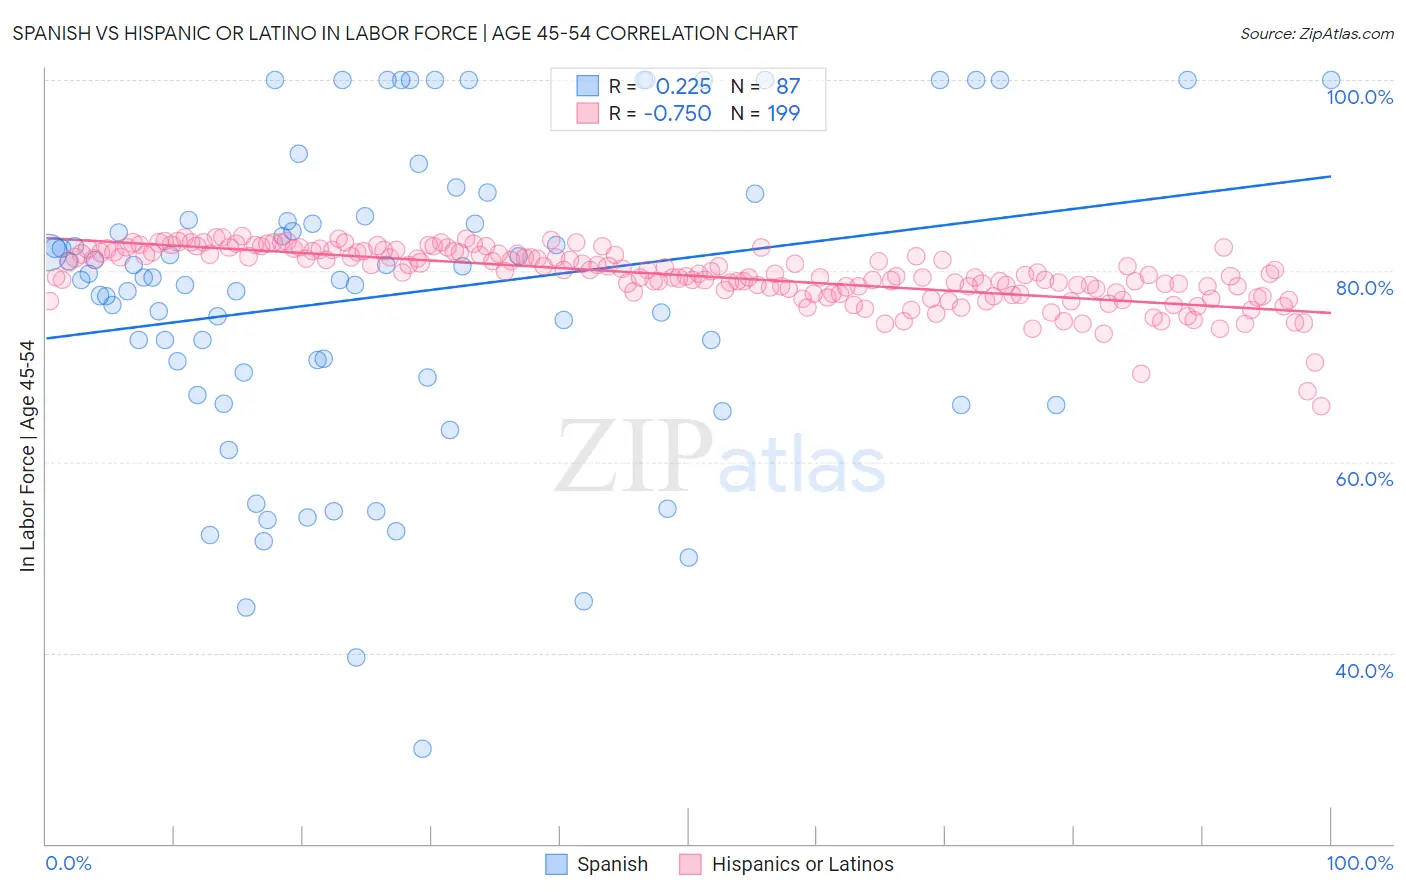
Spanish vs Hispanic or Latino In Labor Force | Age 45-54 Correlation Chart
The statistical analysis conducted on geographies consisting of 421,899,220 people shows a weak positive correlation between the proportion of Spanish and labor force participation rate among population between the ages 45 and 54 in the United States with a correlation coefficient (R) of 0.225 and weighted average of 81.3%. Similarly, the statistical analysis conducted on geographies consisting of 576,352,392 people shows a strong negative correlation between the proportion of Hispanics or Latinos and labor force participation rate among population between the ages 45 and 54 in the United States with a correlation coefficient (R) of -0.750 and weighted average of 80.1%, a difference of 1.5%.
In Labor Force | Age 45-54 Correlation Summary
| Measurement | Spanish | Hispanic or Latino |
| Minimum | 30.0% | 65.8% |
| Maximum | 100.0% | 83.7% |
| Range | 70.0% | 17.9% |
| Mean | 77.5% | 79.5% |
| Median | 79.3% | 79.8% |
| Interquartile 25% (IQ1) | 68.8% | 77.8% |
| Interquartile 75% (IQ3) | 85.7% | 81.9% |
| Interquartile Range (IQR) | 16.9% | 4.1% |
| Standard Deviation (Sample) | 16.2% | 3.0% |
| Standard Deviation (Population) | 16.1% | 3.0% |
Similar Demographics by In Labor Force | Age 45-54
Demographics Similar to Spanish by In Labor Force | Age 45-54
In terms of in labor force | age 45-54, the demographic groups most similar to Spanish are Bangladeshi (81.3%, a difference of 0.010%), Immigrants from Barbados (81.3%, a difference of 0.010%), Alsatian (81.3%, a difference of 0.040%), Immigrants from Honduras (81.4%, a difference of 0.060%), and Chippewa (81.3%, a difference of 0.060%).
| Demographics | Rating | Rank | In Labor Force | Age 45-54 |
| Hondurans | 0.1 /100 | #265 | Tragic 81.4% |
| Immigrants | St. Vincent and the Grenadines | 0.1 /100 | #266 | Tragic 81.4% |
| West Indians | 0.1 /100 | #267 | Tragic 81.4% |
| Immigrants | Honduras | 0.0 /100 | #268 | Tragic 81.4% |
| Alsatians | 0.0 /100 | #269 | Tragic 81.3% |
| Bangladeshis | 0.0 /100 | #270 | Tragic 81.3% |
| Immigrants | Barbados | 0.0 /100 | #271 | Tragic 81.3% |
| Spanish | 0.0 /100 | #272 | Tragic 81.3% |
| Chippewa | 0.0 /100 | #273 | Tragic 81.3% |
| British West Indians | 0.0 /100 | #274 | Tragic 81.2% |
| Immigrants | Nonimmigrants | 0.0 /100 | #275 | Tragic 81.2% |
| U.S. Virgin Islanders | 0.0 /100 | #276 | Tragic 81.2% |
| Guatemalans | 0.0 /100 | #277 | Tragic 81.2% |
| Immigrants | Guatemala | 0.0 /100 | #278 | Tragic 81.1% |
| Immigrants | Micronesia | 0.0 /100 | #279 | Tragic 81.1% |
Demographics Similar to Hispanics or Latinos by In Labor Force | Age 45-54
In terms of in labor force | age 45-54, the demographic groups most similar to Hispanics or Latinos are Immigrants from Dominican Republic (80.1%, a difference of 0.010%), Immigrants from the Azores (80.1%, a difference of 0.020%), Spanish American (80.1%, a difference of 0.050%), Immigrants from Central America (80.2%, a difference of 0.090%), and Blackfeet (80.0%, a difference of 0.12%).
| Demographics | Rating | Rank | In Labor Force | Age 45-54 |
| Americans | 0.0 /100 | #297 | Tragic 80.4% |
| Marshallese | 0.0 /100 | #298 | Tragic 80.3% |
| Dominicans | 0.0 /100 | #299 | Tragic 80.3% |
| Fijians | 0.0 /100 | #300 | Tragic 80.2% |
| Spanish American Indians | 0.0 /100 | #301 | Tragic 80.2% |
| Immigrants | Central America | 0.0 /100 | #302 | Tragic 80.2% |
| Immigrants | Azores | 0.0 /100 | #303 | Tragic 80.1% |
| Hispanics or Latinos | 0.0 /100 | #304 | Tragic 80.1% |
| Immigrants | Dominican Republic | 0.0 /100 | #305 | Tragic 80.1% |
| Spanish Americans | 0.0 /100 | #306 | Tragic 80.1% |
| Blackfeet | 0.0 /100 | #307 | Tragic 80.0% |
| Central American Indians | 0.0 /100 | #308 | Tragic 80.0% |
| Potawatomi | 0.0 /100 | #309 | Tragic 80.0% |
| Inupiat | 0.0 /100 | #310 | Tragic 79.9% |
| Mexicans | 0.0 /100 | #311 | Tragic 79.8% |