Navajo vs Hispanic or Latino Female Unemployment
COMPARE
Navajo
Hispanic or Latino
Female Unemployment
Female Unemployment Comparison
Navajo
Hispanics or Latinos
7.3%
FEMALE UNEMPLOYMENT
0.0/ 100
METRIC RATING
337th/ 347
METRIC RANK
6.2%
FEMALE UNEMPLOYMENT
0.0/ 100
METRIC RATING
308th/ 347
METRIC RANK
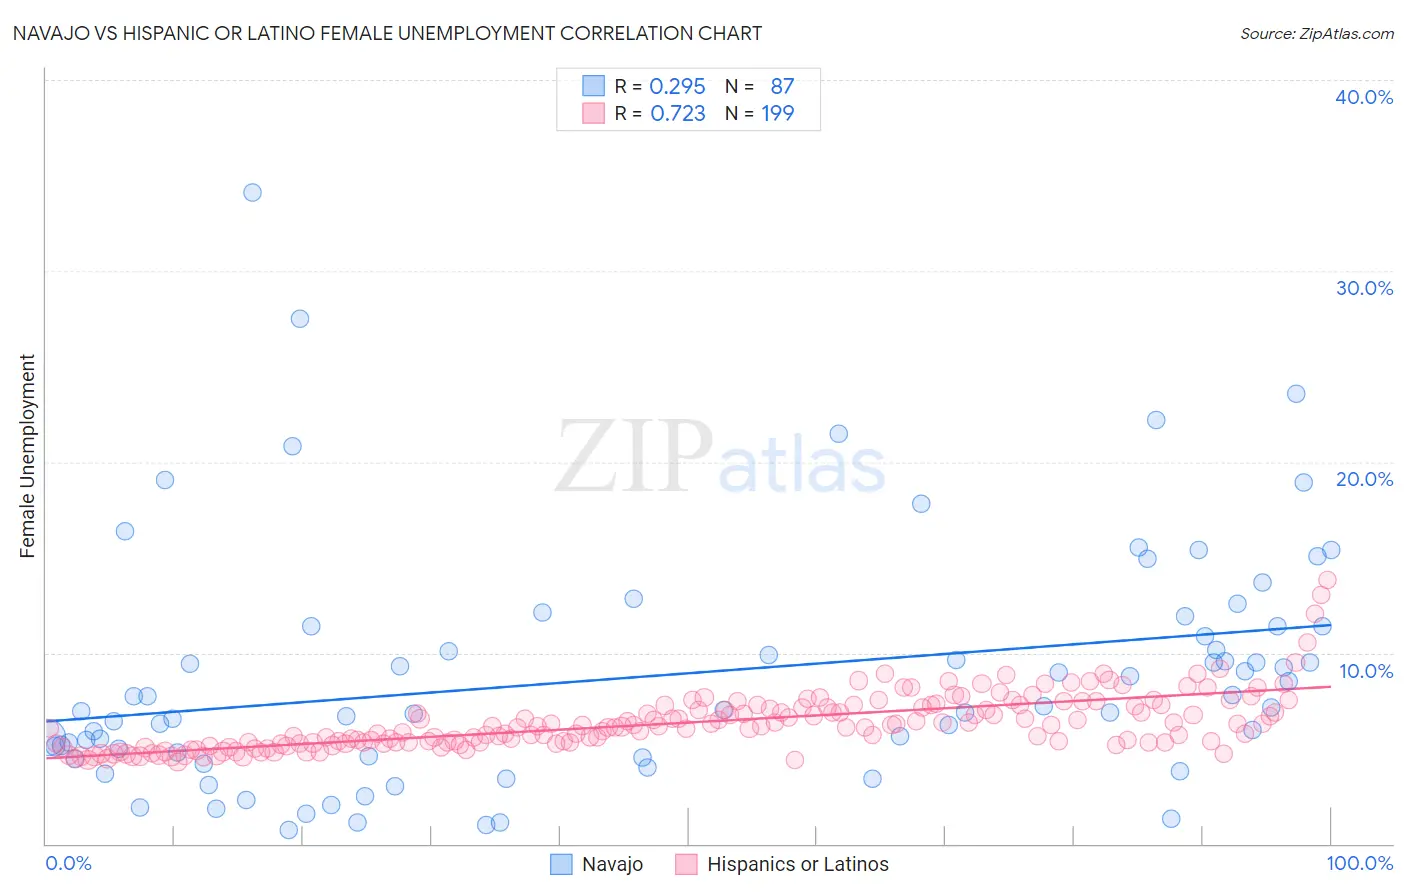
Navajo vs Hispanic or Latino Female Unemployment Correlation Chart
The statistical analysis conducted on geographies consisting of 223,861,194 people shows a weak positive correlation between the proportion of Navajo and unemploymnet rate among females in the United States with a correlation coefficient (R) of 0.295 and weighted average of 7.3%. Similarly, the statistical analysis conducted on geographies consisting of 562,804,515 people shows a strong positive correlation between the proportion of Hispanics or Latinos and unemploymnet rate among females in the United States with a correlation coefficient (R) of 0.723 and weighted average of 6.2%, a difference of 17.0%.
Female Unemployment Correlation Summary
| Measurement | Navajo | Hispanic or Latino |
| Minimum | 0.70% | 4.3% |
| Maximum | 34.1% | 13.8% |
| Range | 33.4% | 9.5% |
| Mean | 8.9% | 6.3% |
| Median | 7.2% | 6.1% |
| Interquartile 25% (IQ1) | 4.6% | 5.3% |
| Interquartile 75% (IQ3) | 11.4% | 7.2% |
| Interquartile Range (IQR) | 6.8% | 1.9% |
| Standard Deviation (Sample) | 6.3% | 1.5% |
| Standard Deviation (Population) | 6.2% | 1.5% |
Similar Demographics by Female Unemployment
Demographics Similar to Navajo by Female Unemployment
In terms of female unemployment, the demographic groups most similar to Navajo are Immigrants from Dominican Republic (7.2%, a difference of 0.94%), Dominican (7.2%, a difference of 1.6%), Immigrants from Armenia (7.1%, a difference of 3.0%), Menominee (7.0%, a difference of 3.5%), and Sioux (7.0%, a difference of 3.5%).
| Demographics | Rating | Rank | Female Unemployment |
| Yakama | 0.0 /100 | #330 | Tragic 6.7% |
| Paiute | 0.0 /100 | #331 | Tragic 6.8% |
| Sioux | 0.0 /100 | #332 | Tragic 7.0% |
| Menominee | 0.0 /100 | #333 | Tragic 7.0% |
| Immigrants | Armenia | 0.0 /100 | #334 | Tragic 7.1% |
| Dominicans | 0.0 /100 | #335 | Tragic 7.2% |
| Immigrants | Dominican Republic | 0.0 /100 | #336 | Tragic 7.2% |
| Navajo | 0.0 /100 | #337 | Tragic 7.3% |
| Tohono O'odham | 0.0 /100 | #338 | Tragic 7.7% |
| Immigrants | Yemen | 0.0 /100 | #339 | Tragic 7.8% |
| Hopi | 0.0 /100 | #340 | Tragic 8.1% |
| Inupiat | 0.0 /100 | #341 | Tragic 8.2% |
| Puerto Ricans | 0.0 /100 | #342 | Tragic 8.3% |
| Arapaho | 0.0 /100 | #343 | Tragic 8.8% |
| Pima | 0.0 /100 | #344 | Tragic 9.3% |
Demographics Similar to Hispanics or Latinos by Female Unemployment
In terms of female unemployment, the demographic groups most similar to Hispanics or Latinos are Shoshone (6.2%, a difference of 0.060%), Immigrants from Central America (6.2%, a difference of 0.070%), Spanish American Indian (6.2%, a difference of 0.23%), Immigrants from Jamaica (6.2%, a difference of 0.29%), and Ecuadorian (6.3%, a difference of 0.58%).
| Demographics | Rating | Rank | Female Unemployment |
| Immigrants | Barbados | 0.0 /100 | #301 | Tragic 6.2% |
| U.S. Virgin Islanders | 0.0 /100 | #302 | Tragic 6.2% |
| Barbadians | 0.0 /100 | #303 | Tragic 6.2% |
| Immigrants | Jamaica | 0.0 /100 | #304 | Tragic 6.2% |
| Spanish American Indians | 0.0 /100 | #305 | Tragic 6.2% |
| Immigrants | Central America | 0.0 /100 | #306 | Tragic 6.2% |
| Shoshone | 0.0 /100 | #307 | Tragic 6.2% |
| Hispanics or Latinos | 0.0 /100 | #308 | Tragic 6.2% |
| Ecuadorians | 0.0 /100 | #309 | Tragic 6.3% |
| Central American Indians | 0.0 /100 | #310 | Tragic 6.3% |
| Immigrants | Mexico | 0.0 /100 | #311 | Tragic 6.3% |
| Immigrants | Grenada | 0.0 /100 | #312 | Tragic 6.3% |
| Belizeans | 0.0 /100 | #313 | Tragic 6.3% |
| Immigrants | Ecuador | 0.0 /100 | #314 | Tragic 6.4% |
| Pueblo | 0.0 /100 | #315 | Tragic 6.4% |